Depending on the volume of data, number of variables, time period, and other data points, you can create charts from the following available types:
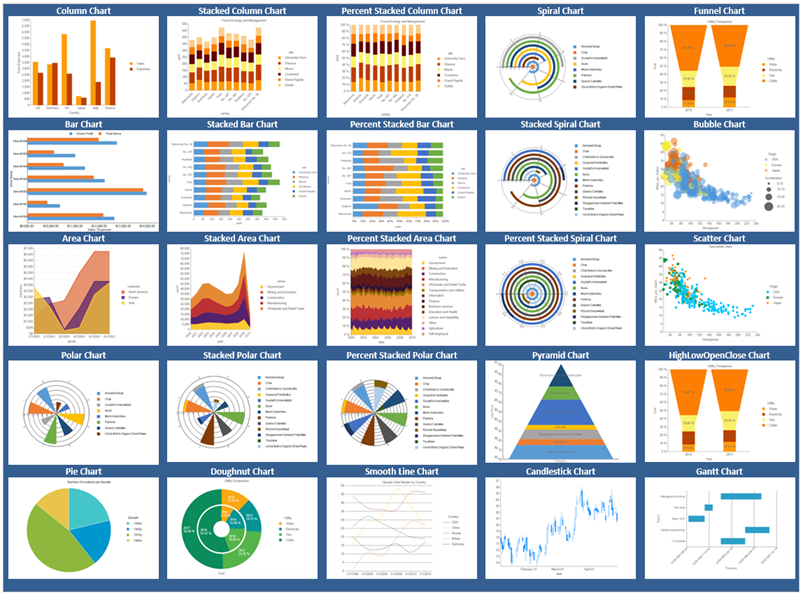
Chart Types
- Column Chart
- Column, Stacked Column, and Percent Stacked Column.
- Bar Chart
- Bar, Stacked Bar, and Percent Stacked Bar.
- Line Chart
- Line and Smooth Line.
- Area Chart
- Area, Stacked Area, and Stacked Percent Area.
- Pie Chart
- Pie and Doughnut.
- Spiral Chart
- Spiral, Stacked Spiral, and Percent Stacked Spiral.
- Polar Chart
- Polar, Stacked Polar, and Percent Stacked Polar.
- Other Chart Types
- Pyramid, Funnel, Bubble, Scatter, Gantt, High Low close, High Low Open Close, and Candlestick.
See Also