Polar charts present data with geographical component. With a polar chart, you can select from the following subtypes.
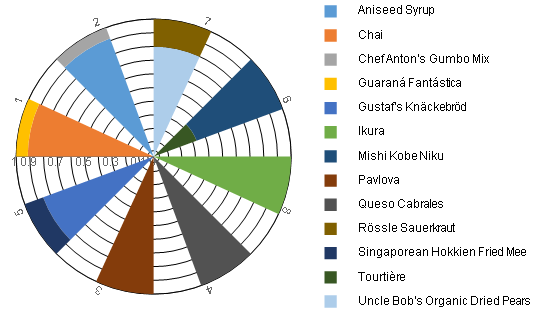
Polar
Polar charts plot series with circular x-axis representing angle values and radial y-axis representing radius values.
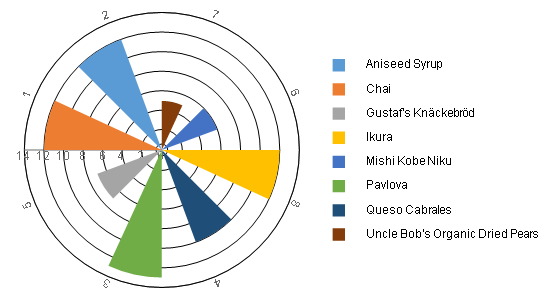
Stacked Polar
Plots multiple series one on top of the other showing contribution of each value to the total.
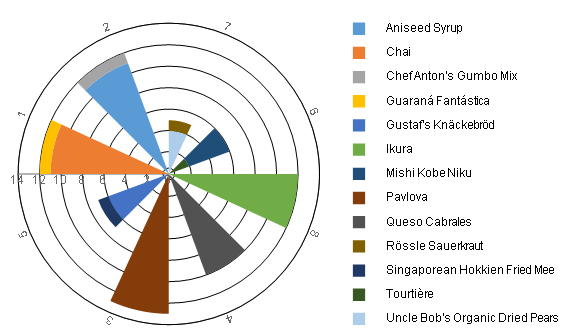
Percent Stacked Polar
Plots multiple series one on top of the other showing percentage contribution of each value to the total.