Pie charts present each category as a slice of pie or doughnut, sized according to value. Series groups are not represented in pie charts. With a pie chart, you can select from the following subtypes.
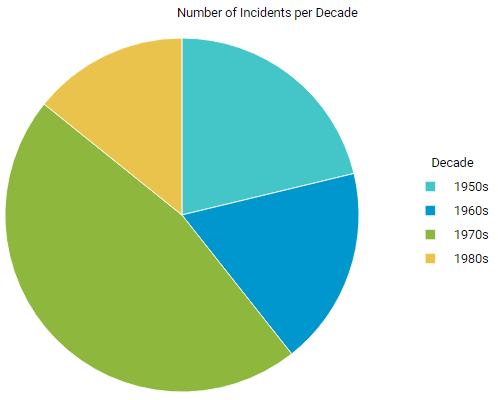
Pie
Shows how the percentage of each data item contributes to the total.
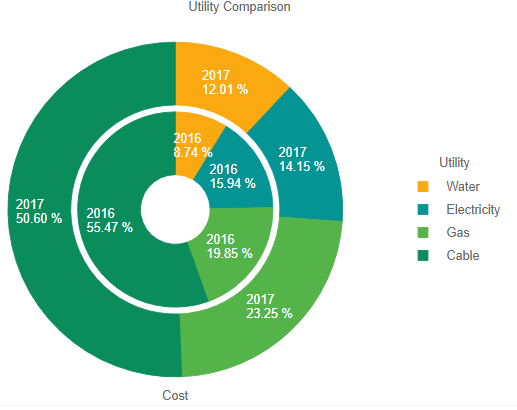
Doughnut
Shows how the percentage of each data item contributes to a total percentage.