Line charts present each series as a point, and connect the points with a line. The y-axis values determine the heights of the points, while the x-axis displays the category labels. With a line chart, you can select from the following subtypes.
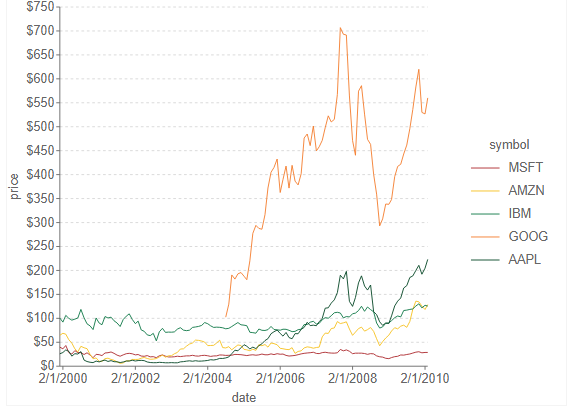
Line
Compares trends over a period of time or in certain categories.
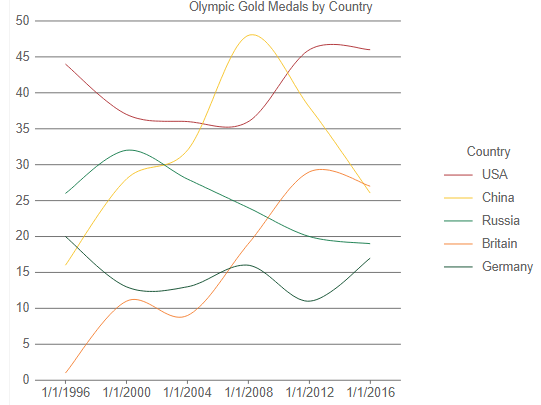
Smooth Line
Plots curves rather than angled lines through the data points in a series to compare trends over a period of time or in certain categories.