The Y plot area contains series that have values in one dimension.
When visualized in 2D, a Y plot area takes the form of a rectangle with the x-axis representing categories and the y-axis representing values.
When visualized in 3D, a Y plot area takes the form of a cube with the x-axis representing categories, the y-axis representing values, and the z-axis (depth) representing series.
A Y plot area can be oriented vertically or horizontally. When oriented vertically, the x-axis is horizontal and the y-axis is vertical. When oriented horizontally, the x-axis is vertical and the y-axis is horizontal.
You can have any of these types of Y plots.
- Area Charts
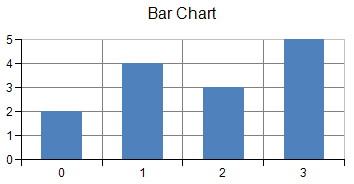
- Bar Charts
- Box Whisker Charts
- Funnel Charts
- Histogram Charts
- Line Charts
- Market Data (High-Low) Charts
- Pareto Charts
- Point Charts
- Stripe Charts
- Waterfall Charts