The bar chart is a basic one-dimensional Cartesian plot such as the one shown in this figure.
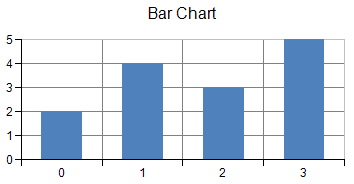
You can have any of these types of bar charts, which represent different ways of displaying the series data.
- (standard) Bar
- Multiple Bar
- Cluster Bar
- Stacked Bar
- Stacked 100% (normalized) Bar
Bar Charts
Each data point contains a single value; how the bar for that point is displayed can be customized. Bar borders and bar fill effects can be assigned for the series or for a point in the series with null (Nothing in VB) indicating unassigned. Bar width and bar depth are measured relative to the floor grid cell (with a range of 0 to 1). Bar origin can be automatically generated or manually assigned.
You can also display any of the bar charts as column charts by setting the Vertical property in the YPlotArea class to False.
Cluster Bar Charts
The cluster bar shows the bars alongside each other horizontally, clustered by series:
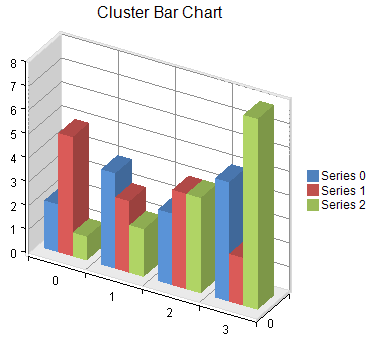
A cluster bar series is a composite series that groups together two or more bar series. A cluster bar series can be assigned a border, fill effect, width, depth, and an origin for the bars as well as a width for the group. Assigning null for a border or fill effect indicates that the property is unset. Group width is measured relative to the floor grid cell (0 = no width, 1 = width of floor grid cell). Bar width is measured relative to the width reserved for the group divided by the number of series in the group (0 = no width, 1 = width reserved for the group divided by the number of series in the group). Bar depth is measured relative to the floor grid cell (0 = no depth, 1 = depth of floor grid cell). The origin can be marked for auto generation by the chart view, in which case the assigned origin is ignored.
Each bar series in the cluster bar series can be assigned a border and a fill effect for the bars.
Each point in a bar series in the cluster bar series has a single data value. Each point is visualized as a bar. All the bars for a given category are placed side by side. Each point in a bar series in a cluster bar series can have a border and a fill effect for the bar.
Stacked Bar Charts
The stacked bar shows the bars vertically stacked:
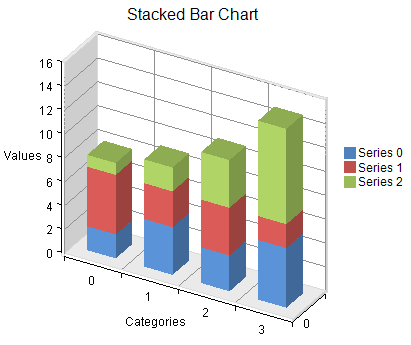
A stacked bar series is a composite series that groups together two or more bar series. A stacked bar series can be assigned a border, fill effect, width, and a depth for the bars. You can also specify whether the group should be displayed 100% stacked. Assigning null for a border or fill effect indicates that the property is unset. Width and depth are measured relative to the floor grid cell (0 = no width or depth, 1 = width or depth of floor grid cell).
Each bar series in the stacked bar series can be assigned a border and a fill effect for the bars.
Each point in a bar series in a stacked bar series has a single data value. Each point is visualized as a bar. All the bars in a given category are stacked vertically. Each point in a bar series in a stacked bar series can have a border and a fill effect for the bar.
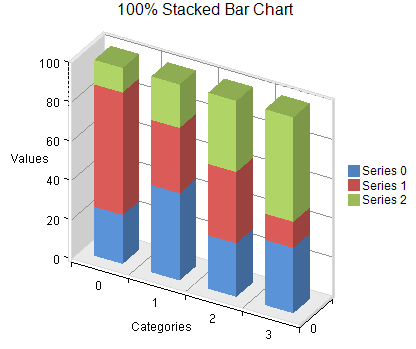
Stacked 100% Bar Charts
The stacked 100% bar chart shows the bars vertically stacked and spread all the way to the top (100%) but spread proportionately; otherwise, it is similar to a stacked bar chart:
For more information on the bar series object in the API, refer to the BarSeries class.