A funnel chart shows values across multiple stages. The values typically decrease at each stage.
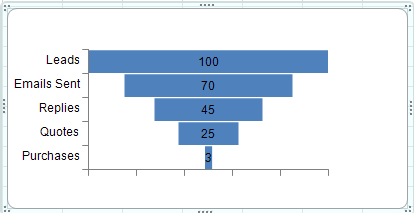
Funnel charts are useful for sales and other types of data. For example, determining how many web site visits lead to product purchases.
You can use the FunnelSeries class and the YPlotArea class to add a funnel chart.
For information about creating charts in the Spread Designer or the Chart Designer, refer to Adding a Chart Control or Using the Chart Designer.
Using Code
- Add data for the chart with the FunnelSeries class.
- Specify the plot area.
- Add the chart.
Example
This example creates a funnel chart.
| C# |
Copy Code
|
|---|---|
| FarPoint.Win.Chart.FunnelSeries funnel= new FarPoint.Win.Chart.FunnelSeries(); funnel.Values.Add(100); funnel.Values.Add(70); funnel.Values.Add(45); funnel.Values.Add(25); funnel.Values.Add(3); funnel.CategoryNames.Add("Leads"); funnel.CategoryNames.Add("Emails Sent"); funnel.CategoryNames.Add("Replies"); funnel.CategoryNames.Add("Quotes"); funnel.CategoryNames.Add("Purchases"); FarPoint.Win.Chart.YPlotArea plotArea = new FarPoint.Win.Chart.YPlotArea(); plotArea.Location = new PointF(0.2f, 0.2f); plotArea.Size = new SizeF(0.6f, 0.6f); plotArea.Series.Add(funnel); FarPoint.Win.Chart.ChartModel model = new FarPoint.Win.Chart.ChartModel(); model.PlotAreas.Add(plotArea); FarPoint.Win.Spread.Chart.SpreadChart chart = new FarPoint.Win.Spread.Chart.SpreadChart(); chart.Model = model; chart.Left = 0; chart.Top = 150; chart.Size = new Size(400, 200); fpSpread1.ActiveSheet.Charts.Add(chart); |
|
| VB |
Copy Code
|
|---|---|
| Dim funnel As New FarPoint.Win.Chart.FunnelSeries() funnel.Values.Add(100) funnel.Values.Add(70) funnel.Values.Add(45) funnel.Values.Add(25) funnel.Values.Add(3) funnel.CategoryNames.Add("Leads") funnel.CategoryNames.Add("Emails Sent") funnel.CategoryNames.Add("Replies") funnel.CategoryNames.Add("Quotes") funnel.CategoryNames.Add("Purchases") Dim plotArea As New FarPoint.Win.Chart.YPlotArea() plotArea.Location = New PointF(0.2F, 0.2F) plotArea.Size = New SizeF(0.6F, 0.6F) plotArea.Series.Add(funnel) Dim model As New FarPoint.Win.Chart.ChartModel() model.PlotAreas.Add(plotArea) Dim chart As New FarPoint.Win.Spread.Chart.SpreadChart() chart.Model = model chart.Left = 0 chart.Top = 150 chart.Size = New Size(400, 200) fpSpread1.ActiveSheet.Charts.Add(chart) |
|
See Also