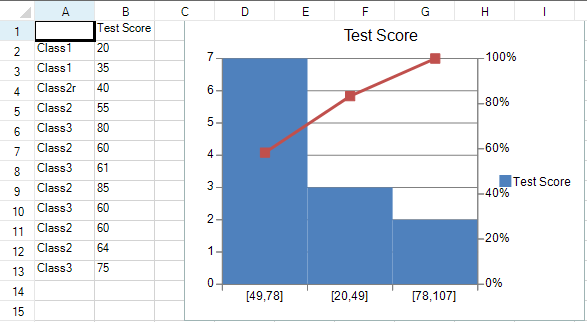
A pareto chart contains both bars and a line graph. Individual values are represented in descending order by bars and the cumulative total is represented by a line. The pareto chart is used to highlight the most important items in a set of values.
You can use the ParetoSeries class and the YPlotArea class to create a pareto chart.
For information about creating charts in the Spread Designer or the Chart Designer, refer to Adding a Chart Control or Using the Chart Designer.
Using Code
- Add data for the chart.
- Specify the series with the ParetoSeries class.
- Add the chart.
Example
This example creates a pareto chart.
| C# |
Copy Code
|
|---|---|
| fpSpread1.ActiveSheet.Cells[0, 1].Text = "Test Score"; fpSpread1.ActiveSheet.SetClipValue(1, 0, 13, 1, "Class1\r\nClass1\r\nClass2r\nClass2\r\nClass3\r\nClass2\r\nClass3\r\nClass2\r\nClass3\r\nClass2\r\nClass2\r\nClass3"); fpSpread1.ActiveSheet.SetClipValue(1, 1, 13, 1, "20\r\n35\r\n40\r\n55\r\n80\r\n60\r\n61\r\n85\r\n60\r\n60\r\n64\r\n75"); fpSpread1.ActiveSheet.AddChart(new FarPoint.Win.Spread.Model.CellRange(0, 0, 13, 2), typeof(FarPoint.Win.Chart.ParetoSeries), 400, 300, 150, 0); |
|
| VB |
Copy Code
|
|---|---|
| fpSpread1.ActiveSheet.Cells(0, 1).Text = "Test Score" fpSpread1.ActiveSheet.SetClipValue(1, 0, 13, 1, "Class1" & vbCr & vbLf & "Class1" & vbCr & vbLf & "Class2r" & vbLf & "Class2" & vbCr & vbLf & "Class3" & vbCr & vbLf & "Class2" & vbCr & vbLf & "Class3" & vbCr & vbLf & "Class2" & vbCr & vbLf & "Class3" & vbCr & vbLf & "Class2" & vbCr & vbLf & "Class2" & vbCr & vbLf & "Class3") fpSpread1.ActiveSheet.SetClipValue(1, 1, 13, 1, "20" & vbCr & vbLf & "35" & vbCr & vbLf & "40" & vbCr & vbLf & "55" & vbCr & vbLf & "80" & vbCr & vbLf & "60" & vbCr & vbLf & "61" & vbCr & vbLf & "85" & vbCr & vbLf & "60" & vbCr & vbLf & "60" & vbCr & vbLf & "64" & vbCr & vbLf & "75") fpSpread1.ActiveSheet.AddChart(New FarPoint.Win.Spread.Model.CellRange(0, 0, 13, 2), GetType(FarPoint.Win.Chart.ParetoSeries), 400, 300, 150, 0) |
|
See Also