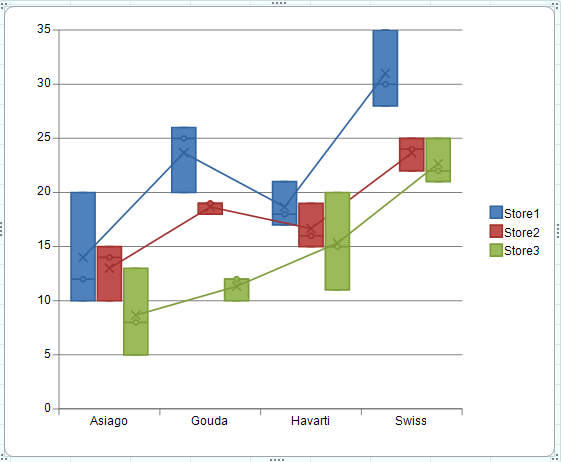
A box whisker chart displays the distribution of data into quartiles. The boxes may also have lines extending vertically (whiskers). The lines indicate variability outside the upper and lower quartiles. A point outside the whisker is an outlier point. Box whisker charts are commonly used in statistical analysis.
You can use the BoxWhiskerSeries, the ClusteredBoxWhiskerSeries, and the YPlotArea classes to create a box whisker chart with multiple series as shown in the following image.
For information about creating charts in the Spread Designer or the Chart Designer, refer to Adding a Chart Control or Using the Chart Designer.
Using Code
- Add data for the chart.
- Add the chart.
- Set any additional properties such as whether to show the mean lines.
Example
This example creates a box whisker chart.
| C# |
Copy Code
|
|---|---|
| fpSpread1.ActiveSheet.Cells[0, 1].Text = "Cheese"; fpSpread1.ActiveSheet.Cells[0, 2].Text = "Store1"; fpSpread1.ActiveSheet.Cells[0, 3].Text = "Store2"; fpSpread1.ActiveSheet.Cells[0, 4].Text = "Store3"; fpSpread1.ActiveSheet.Cells[1, 1].Text = "Asiago"; fpSpread1.ActiveSheet.Cells[2, 1].Text = "Gouda"; fpSpread1.ActiveSheet.Cells[3, 1].Text = "Havarti"; fpSpread1.ActiveSheet.Cells[4, 1].Text = "Swiss"; fpSpread1.ActiveSheet.Cells[5, 1].Text = "Asiago"; fpSpread1.ActiveSheet.Cells[6, 1].Text = "Gouda"; fpSpread1.ActiveSheet.Cells[7, 1].Text = "Havarti"; fpSpread1.ActiveSheet.Cells[8, 1].Text = "Swiss"; fpSpread1.ActiveSheet.Cells[9, 1].Text = "Asiago"; fpSpread1.ActiveSheet.Cells[10, 1].Text = "Gouda"; fpSpread1.ActiveSheet.Cells[11, 1].Text = "Havarti"; fpSpread1.ActiveSheet.Cells[12, 1].Text = "Swiss"; fpSpread1.ActiveSheet.Cells[1, 2].Value = 20; fpSpread1.ActiveSheet.Cells[2, 2].Value = 25; fpSpread1.ActiveSheet.Cells[3, 2].Value = 21; fpSpread1.ActiveSheet.Cells[4, 2].Value = 30; fpSpread1.ActiveSheet.Cells[5, 2].Value = 10; fpSpread1.ActiveSheet.Cells[6, 2].Value = 26; fpSpread1.ActiveSheet.Cells[7, 2].Value = 18; fpSpread1.ActiveSheet.Cells[8, 2].Value = 28; fpSpread1.ActiveSheet.Cells[9, 2].Value = 12; fpSpread1.ActiveSheet.Cells[10, 2].Value = 20; fpSpread1.ActiveSheet.Cells[11, 2].Value = 17; fpSpread1.ActiveSheet.Cells[12, 2].Value = 35; fpSpread1.ActiveSheet.Cells[1, 3].Value = 15; fpSpread1.ActiveSheet.Cells[2, 3].Value = 18; fpSpread1.ActiveSheet.Cells[3, 3].Value = 19; fpSpread1.ActiveSheet.Cells[4, 3].Value = 22; fpSpread1.ActiveSheet.Cells[5, 3].Value = 10; fpSpread1.ActiveSheet.Cells[6, 3].Value = 19; fpSpread1.ActiveSheet.Cells[7, 3].Value = 15; fpSpread1.ActiveSheet.Cells[8, 3].Value = 25; fpSpread1.ActiveSheet.Cells[9, 3].Value = 14; fpSpread1.ActiveSheet.Cells[10, 3].Value = 19; fpSpread1.ActiveSheet.Cells[11, 3].Value = 16; fpSpread1.ActiveSheet.Cells[12, 3].Value = 24; fpSpread1.ActiveSheet.Cells[1, 4].Value = 5; fpSpread1.ActiveSheet.Cells[2, 4].Value = 12; fpSpread1.ActiveSheet.Cells[3, 4].Value = 20; fpSpread1.ActiveSheet.Cells[4, 4].Value = 25; fpSpread1.ActiveSheet.Cells[5, 4].Value = 8; fpSpread1.ActiveSheet.Cells[6, 4].Value = 10; fpSpread1.ActiveSheet.Cells[7, 4].Value = 11; fpSpread1.ActiveSheet.Cells[8, 4].Value = 22; fpSpread1.ActiveSheet.Cells[9, 4].Value = 13; fpSpread1.ActiveSheet.Cells[10, 4].Value = 12; fpSpread1.ActiveSheet.Cells[11, 4].Value = 15; fpSpread1.ActiveSheet.Cells[12, 4].Value = 21; fpSpread1.ActiveSheet.AddChart(new FarPoint.Win.Spread.Model.CellRange(0, 1, 13, 4), typeof(FarPoint.Win.Chart.ClusteredBoxWhiskerSeries), 550, 450, 300, 0); FarPoint.Win.Chart.ClusteredBoxWhiskerSeries cboxseries = (FarPoint.Win.Chart.ClusteredBoxWhiskerSeries)fpSpread1.Sheets[0].Charts[0].Model.PlotAreas[0].Series[0]; foreach(FarPoint.Win.Chart.BoxWhiskerSeries boxseries in cboxseries.Series) { boxseries.ShowInnerPoints = true; boxseries.ShowMeanLine = true; boxseries.ShowMeanMarkers = true; boxseries.ShowOutlierPoints = true; } |
|
| VB |
Copy Code
|
|---|---|
| fpSpread1.ActiveSheet.Cells(0, 1).Text = "Cheese" fpSpread1.ActiveSheet.Cells(0, 2).Text = "Store1" fpSpread1.ActiveSheet.Cells(0, 3).Text = "Store2" fpSpread1.ActiveSheet.Cells(0, 4).Text = "Store3" fpSpread1.ActiveSheet.Cells(1, 1).Text = "Asiago" fpSpread1.ActiveSheet.Cells(2, 1).Text = "Gouda" fpSpread1.ActiveSheet.Cells(3, 1).Text = "Havarti" fpSpread1.ActiveSheet.Cells(4, 1).Text = "Swiss" fpSpread1.ActiveSheet.Cells(5, 1).Text = "Asiago" fpSpread1.ActiveSheet.Cells(6, 1).Text = "Gouda" fpSpread1.ActiveSheet.Cells(7, 1).Text = "Havarti" fpSpread1.ActiveSheet.Cells(8, 1).Text = "Swiss" fpSpread1.ActiveSheet.Cells(9, 1).Text = "Asiago" fpSpread1.ActiveSheet.Cells(10, 1).Text = "Gouda" fpSpread1.ActiveSheet.Cells(11, 1).Text = "Havarti" fpSpread1.ActiveSheet.Cells(12, 1).Text = "Swiss" fpSpread1.ActiveSheet.Cells(1, 2).Value = 20 fpSpread1.ActiveSheet.Cells(2, 2).Value = 25 fpSpread1.ActiveSheet.Cells(3, 2).Value = 21 fpSpread1.ActiveSheet.Cells(4, 2).Value = 30 fpSpread1.ActiveSheet.Cells(5, 2).Value = 10 fpSpread1.ActiveSheet.Cells(6, 2).Value = 26 fpSpread1.ActiveSheet.Cells(7, 2).Value = 18 fpSpread1.ActiveSheet.Cells(8, 2).Value = 28 fpSpread1.ActiveSheet.Cells(9, 2).Value = 12 fpSpread1.ActiveSheet.Cells(10, 2).Value = 20 fpSpread1.ActiveSheet.Cells(11, 2).Value = 17 fpSpread1.ActiveSheet.Cells(12, 2).Value = 35 fpSpread1.ActiveSheet.Cells(1, 3).Value = 15 fpSpread1.ActiveSheet.Cells(2, 3).Value = 18 fpSpread1.ActiveSheet.Cells(3, 3).Value = 19 fpSpread1.ActiveSheet.Cells(4, 3).Value = 22 fpSpread1.ActiveSheet.Cells(5, 3).Value = 10 fpSpread1.ActiveSheet.Cells(6, 3).Value = 19 fpSpread1.ActiveSheet.Cells(7, 3).Value = 15 fpSpread1.ActiveSheet.Cells(8, 3).Value = 25 fpSpread1.ActiveSheet.Cells(9, 3).Value = 14 fpSpread1.ActiveSheet.Cells(10, 3).Value = 19 fpSpread1.ActiveSheet.Cells(11, 3).Value = 16 fpSpread1.ActiveSheet.Cells(12, 3).Value = 24 fpSpread1.ActiveSheet.Cells(1, 4).Value = 5 fpSpread1.ActiveSheet.Cells(2, 4).Value = 12 fpSpread1.ActiveSheet.Cells(3, 4).Value = 20 fpSpread1.ActiveSheet.Cells(4, 4).Value = 25 fpSpread1.ActiveSheet.Cells(5, 4).Value = 8 fpSpread1.ActiveSheet.Cells(6, 4).Value = 10 fpSpread1.ActiveSheet.Cells(7, 4).Value = 11 fpSpread1.ActiveSheet.Cells(8, 4).Value = 22 fpSpread1.ActiveSheet.Cells(9, 4).Value = 13 fpSpread1.ActiveSheet.Cells(10, 4).Value = 12 fpSpread1.ActiveSheet.Cells(11, 4).Value = 15 fpSpread1.ActiveSheet.Cells(12, 4).Value = 21 fpSpread1.ActiveSheet.AddChart(New FarPoint.Win.Spread.Model.CellRange(0, 1, 13, 4), GetType(FarPoint.Win.Chart.ClusteredBoxWhiskerSeries), 550, 450, 300, 0) Dim cboxseries As FarPoint.Win.Chart.ClusteredBoxWhiskerSeries = DirectCast(fpSpread1.Sheets(0).Charts(0).Model.PlotAreas(0).Series(0), FarPoint.Win.Chart.ClusteredBoxWhiskerSeries) For Each boxseries As FarPoint.Win.Chart.BoxWhiskerSeries In cboxseries.Series boxseries.ShowInnerPoints = True boxseries.ShowMeanLine = True boxseries.ShowMeanMarkers = True boxseries.ShowOutlierPoints = True Next |
|
See Also