Stripes can be used in a basic one-dimensional Cartesian plot such as the one shown in this figure:
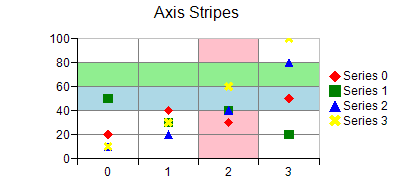
You can specify a start and end value for the stripe on the chart axis. You can also specify a fill type and color for the stripe. A stripe can be added to a chart with the axis properties in the appropriate plot area class.
For more information on the stripe object in the API, refer to the Stripe class.
For more information on the value axis series object in the API, refer to the ValueAxis class.