Wijmo UI for the Web
seriesList Option
wijmo.chart.wijbarchart Namespace > options type : seriesList Option

Creates an array of series objects that contain data values and labels to display in the chart. 

Each series object consists of a label attribute and a data attribute with its own array of X and Y values. X values are generally text values, while Y values are generally numeric. You can also use the legendEntry attribute to determine whether to show each series object in the legend.

Type: Array

Default value: []

Syntax
$(function () {
    
    // Get value
    var returnsValue; // Type:  array
    returnsValue = $(".selector").wijbarchart("option", "seriesList");
    
    // Set value
    var newValue; // Type:  array
    $(".selector").wijbarchart("option", "seriesList", newValue);
        
});
var seriesList : array;
Example

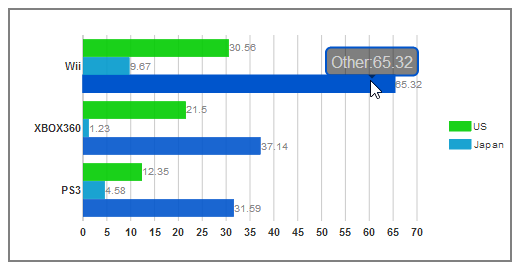
This code creates a barchart with three series objects: USA, Japan, and Other, each with a set of three data values: Wii, XBOX360, and PS3. The third series has the legendEntry attribute set to false so that only the first two series objects appear in the legend, as in the image below.

<script id="scriptInit" type="text/javascript">
    $(document).ready(function () {
        $("#wijbarchart").wijbarchart({
            seriesList: [{
                label: "US",
                data: 
                { 
                    x: ['PS3', 'XBOX360', 'Wii'], 
                    y: [12.35, 21.50, 30.56] 
                }
            }, 
            {
                label: "Japan",
                data: 
                { 
                    x: ['PS3', 'XBOX360', 'Wii'], 
                    y: [4.58, 1.23, 9.67] 
                }
            }, 
            {
                label: "Other",
                legendEntry: false,
                data: 
                { 
                    x: ['PS3', 'XBOX360', 'Wii'], 
                    y: [31.59, 37.14, 65.32] 
                }
            }],
        });
    });
</script>
Remarks

Attributes

data An object that contains arrays of X and Y data for the chart series. If you want to change the positioning of the X and Y axes, see the horizontal option.

Type: Object

Default: {}

x An array of data strings to display along the x axis.

Type: array

Default: []

y An array of numeric data values to plot along the y axis.

Type: array

Default: []

label A string value used to label the chart series. By default, this value appears in the legend entry for the series and in the hint when you mouse over a bar in the series. To prevent a series label from appearing in the legend, use the legendEntry attribute. If you do not provide a label for a series, the label for the series appears as "undefined" in the hint and in the legend.

Type: string

Default: ""

legendEntry A value that indicates whether to display the label and color of the series in the legend of the chart. Set this value to false to leave a series out of the legend.

Type: Boolean

Default: true

See the Clustering Data topic for information on the concept of providing a cluster of numeric Y data values for the same set of X data values.

See Also

Reference

options type
wijbarchart Method