Wijmo UI for the Web
hint Option
wijmo.chart.wijbarchart Namespace > options type : hint Option

Creates an object to use as the tooltip, or hint, when the mouse is over a chart element.

Type: wijmo.chart.chart_hint

Default:

{
            animated: "fade",
            calloutFilled: false, 
            calloutFilledStyle: {fill: "#000"},
            compass: "north", 
            content: null, 
            contentStyle: {fill: "#d1d1d1", "font-size": 16},
            duration: 120, 
            easing: "easeOutExpo", 
            enable: true, 
            hideAnimated: "fade",
            hideDelay: 150, 
            hideDuration: 120,
            hideEasing: "easeOutExpo",
            offsetX: 0, 
            offsetY: 0,  
            showAnimated: "fade", 
            showCallout: true, 
            showDelay: 150, 
            showDuration: 120, 
            showEasing: "easeOutExpo", 
            style: {fill: "270-#333333-#000000", "stroke-width": "2"},
            title: null, 
            titleStyle: {fill: "#d1d1d1", "font-size": 16},
}
Syntax
$(function () {
    
    // Get value
    var returnsValue; // Type:  wijmo.chart.chart_hint
    returnsValue = $(".selector").wijbarchart("option", "hint");
    
    // Set value
    var newValue; // Type:  wijmo.chart.chart_hint
    $(".selector").wijbarchart("option", "hint", newValue);
        
});
var hint : chart_hint;
Example

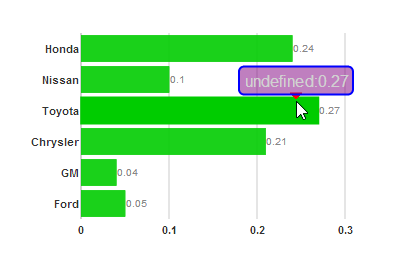
This example sets the calloutFilled attribute of the hint to true, sets the fill and outline colors of the calloutFilledStyle to red, and sets the style of the hint to purple with a blue outline so that you can easily see the different elements.

<script id="scriptInit" type="text/javascript">
    $(document).ready(function () {
        $("#wijbarchart").wijbarchart({
            hint: {
                calloutFilled: true, 
                calloutFilledStyle: {fill: "red", stroke: "red"},
                style: {fill: "purple", "stroke-width": "2", stroke: "blue"}
            },
            seriesList: [{
                legendEntry: false,
                data: { 
                    x: ['Ford', 'GM', 'Chrysler', 'Toyota', 'Nissan', 'Honda'], 
                    y: [.05, .04, .21, .27, .1, .24] 
                }
            }],
        });
    });
</script>
Remarks
By default, it displays the value of the seriesList label and Y data for the chart
See Also

Reference

options type
wijbarchart Method