Adding a Second Y-Axis
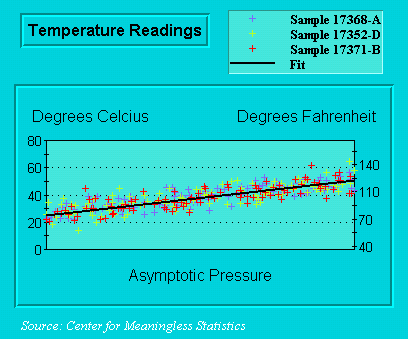
There are two ways to create a second Y-axis (called the Y2 axis) on a chart. The simplest way is to define a numeric relationship between the Y and Y2 axes, as shown below. Use this to display a different scale or interpretation of the same graph data.
The other way to create a Y2-axis is to create a combination chart. See Creating Combination Charts using ChartGroups for a complete discussion.
 Defining Y2-Axis Multiplier
Use the Multiplier Y2-axis property to define the multiplication factor for the Y2-axis. This property generates Y2-axis values from the Y-axis annotation. The multiplication factor can be positive or negative. Multiplier is located on the Annotation Tab (Axes) on the Property Pages.
Using a Constant Value
Use the Constant Y2-axis property to define a value to be added to or subtracted from the Y2-axis values generated by Multiplier. Constant is located on the Annotation Tab (Axes) on the Property Pages.
Hiding Y2-Axis
Use the IsShowing axis property to remove the Y2-axis from the display. IsShowing is located on the General Tab (Axes) on the Property Pages.
Other Y2-Axis Properties
You can customize most axis properties for the Y2-axis, including AnnotationMethod, Min, Max, IsLogarithmic, NumMethod, NumSpacing, and Title.