Creating Combination Charts Using ChartGroups
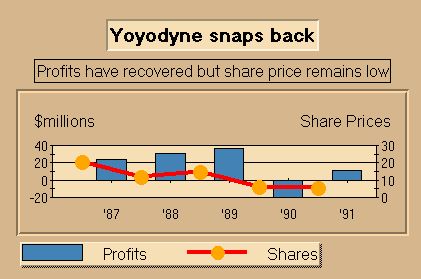
A combination chart displays two separate groups of data in the same chart. Combination charts are useful for comparing two groups of data against the same X-axis.

Each group of data is part of a ChartGroup. A ChartGroup also has a set of ChartStyles, SeriesLabels, PointLabels, and properties that define the chart type and drawing order. Use the first ChartGroup when creating a chart having just one group of data. Use the second ChartGroup when adding a second data group to the chart. The second ChartGroup only works when data exists in the first.
The X-axis is common to both ChartGroups. The first Y-axis applies to the first ChartGroup’s data. The second Y-axis (Y2) applies to the second ChartGroup’s data.
 Loading Second ChartGroup Data