Multiple series from the same major category are compatible with each other and can be combined in a single plot area. For example, a bar series and a line series can be combined together in a YPlotArea.
For details on the API, see the YPlotArea class.
The following classes are used to create the bar and line series example:
Using Code
- Use the BarSeries and LineSeries classes to add data to the Chart control.
- Use the YPlotArea class to create the plot area.
- Set the location and size of the plot area.
- Add both series to the plot area.
- Create a label for the chart.
- Create a chart model and add the plot area and label to the model.
- Create a chart and add the chart model to it.
Example
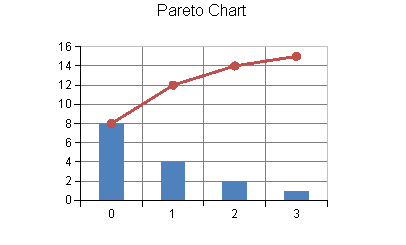
The following example demonstrates using unbound data to create a chart that uses a bar series and a line series.
| C# |
Copy Code
|
|---|---|
BarSeries series0 = new BarSeries(); series0.Values.Add(8.0); series0.Values.Add(4.0); series0.Values.Add(2.0); series0.Values.Add(1.0); LineSeries series1 = new LineSeries(); series1.PointMarker = new BuiltinMarker(MarkerShape.Circle, 7.0f); series1.Values.Add(8.0); series1.Values.Add(12.0); series1.Values.Add(14.0); series1.Values.Add(15.0); YPlotArea plotArea = new YPlotArea(); plotArea.Location = new PointF(0.2f, 0.2f); plotArea.Size = new SizeF(0.6f, 0.6f); plotArea.Series.Add(series0); plotArea.Series.Add(series1); LabelArea label = new LabelArea(); label.Location = new PointF(0.5f, 0.02f); label.AlignmentX = 0.5f; label.AlignmentY = 0.0f; label.Text = "Pareto Chart"; ChartModel model = new ChartModel(); model.LabelAreas.Add(label); model.PlotAreas.Add(plotArea); chart2DControl1.Model = model; |
|
| VB |
Copy Code
|
|---|---|
Dim series0 As New FarPoint.Win.Chart.BarSeries() series0.Values.Add(8.0) series0.Values.Add(4.0) series0.Values.Add(2.0) series0.Values.Add(1.0) Dim series1 As New FarPoint.Win.Chart.LineSeries() series1.PointMarker = New FarPoint.Win.Chart.BuiltinMarker(FarPoint.Win.Chart.MarkerShape.Circle, 7.0F) series1.Values.Add(8.0) series1.Values.Add(12.0) series1.Values.Add(14.0) series1.Values.Add(15.0) Dim plotArea As New FarPoint.Win.Chart.YPlotArea() plotArea.Location = New PointF(0.2F, 0.2F) plotArea.Size = New SizeF(0.6F, 0.6F) plotArea.Series.Add(series0) plotArea.Series.Add(series1) Dim labelArea As New FarPoint.Win.Chart.LabelArea() labelArea.Location = New PointF(0.5F, 0.02F) labelArea.AlignmentX = 0.5F labelArea.AlignmentY = 0.0F labelArea.Text = "Pareto Chart" Dim model As New FarPoint.Win.Chart.ChartModel() model.LabelAreas.Add(labelArea) model.PlotAreas.Add(plotArea) Chart2DControl1.Model = model |
|
See Also