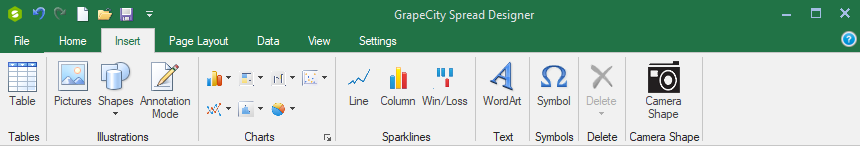
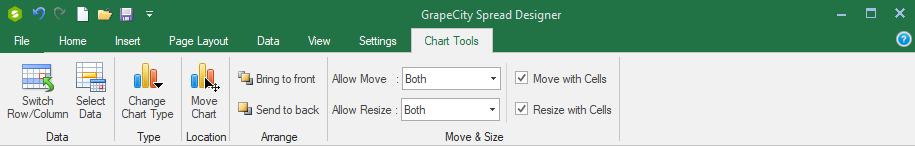
You can add a chart control to the sheet using code or the Spread designer. You can also allow the user to resize the chart and the range of data used in the chart control. The following image shows the Chart section in the Spread Designer under the Insert menu. The second image shows the Chart Tools menu option which is displayed after a chart is added.
Using the Spread Designer or Edit Chart Verb
- Open the Spread Designer and type chart data in the cells (similar to the data in the code example after this section).
- Select a range of cells with data.
- Click on the Insert menu option and then pick the chart type (see the above image).
- The Chart Tool menu will appear with additional options.
- Close the Spread Designer and save the changes.
or
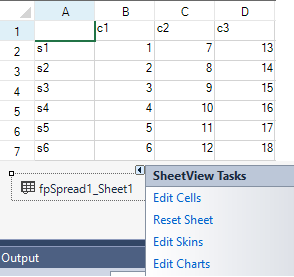
- Click on the fpSpread1_Sheet1 object at the bottom of the page.
- Click on the arrow at the top right of the object and select Edit Charts.
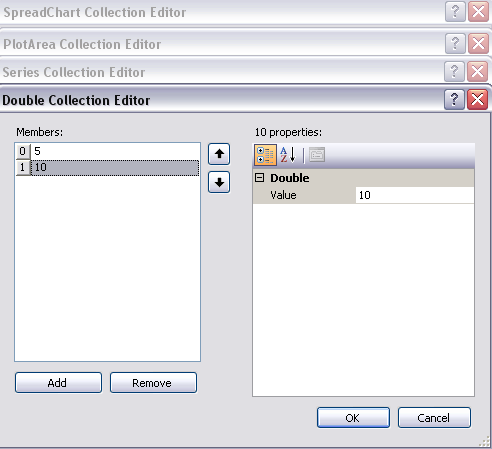
- This brings up the SpreadChart Collection Editor. Click Add to add a chart and then set the chart properties.
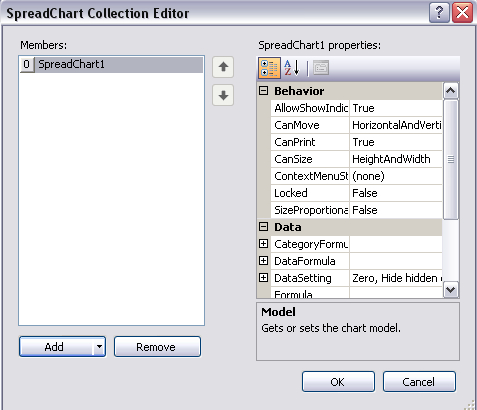
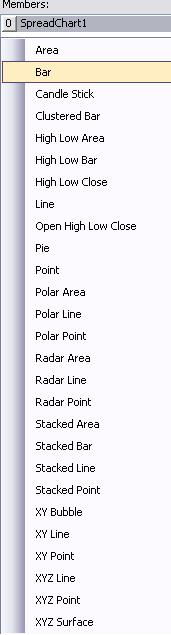
- The Add button has a drop-down menu with chart type options (bar, for example).
- Select Model in the SpreadChart Collection Editor to bring up the chart designer or choose the PlotAreas Collection under Model. Use the Add button drop-down menu to select a plot area type (YPlotArea, for example).
- Use the Series Collection to add a series type (BarSeries, for example). The Add button has a drop-down for the types of series you can add.
- Use the Values Collection to bring up the Double Collection Editor that can be used to add data to the chart.
- Select OK for each dialog.
Using Code
You can add a chart control to the Spread control using code. This example creates data in cells and then adds the chart control.
Example
| C# |
Copy Code
|
|---|---|
fpSpread1.Sheets[0].Cells[0, 1].Value = "c1"; fpSpread1.Sheets[0].Cells[0, 2].Value = "c2"; fpSpread1.Sheets[0].Cells[0, 3].Value = "c3"; fpSpread1.Sheets[0].Cells[1, 0].Value = "s1"; fpSpread1.Sheets[0].Cells[2, 0].Value = "s2"; fpSpread1.Sheets[0].Cells[3, 0].Value = "s3"; fpSpread1.Sheets[0].Cells[4, 0].Value = "s4"; fpSpread1.Sheets[0].Cells[5, 0].Value = "s5"; fpSpread1.Sheets[0].Cells[6, 0].Value = "s6"; fpSpread1.Sheets[0].Cells[1, 1].Value = 1; fpSpread1.Sheets[0].Cells[2, 1].Value = 2; fpSpread1.Sheets[0].Cells[3, 1].Value = 3; fpSpread1.Sheets[0].Cells[4, 1].Value = 4; fpSpread1.Sheets[0].Cells[5, 1].Value = 5; fpSpread1.Sheets[0].Cells[6, 1].Value = 6; fpSpread1.Sheets[0].Cells[1, 2].Value = 7; fpSpread1.Sheets[0].Cells[2, 2].Value = 8; fpSpread1.Sheets[0].Cells[3, 2].Value = 9; fpSpread1.Sheets[0].Cells[4, 2].Value = 10; fpSpread1.Sheets[0].Cells[5, 2].Value = 11; fpSpread1.Sheets[0].Cells[6, 2].Value = 12; fpSpread1.Sheets[0].Cells[1, 3].Value = 13; fpSpread1.Sheets[0].Cells[2, 3].Value = 14; fpSpread1.Sheets[0].Cells[3, 3].Value = 15; fpSpread1.Sheets[0].Cells[4, 3].Value = 16; fpSpread1.Sheets[0].Cells[5, 3].Value = 17; fpSpread1.Sheets[0].Cells[6, 3].Value = 18; FarPoint.Win.Spread.Model.CellRange range = new FarPoint.Win.Spread.Model.CellRange(0, 0, 7, 4); fpSpread1.Sheets[0].AddChart(range, typeof(FarPoint.Win.Chart.BarSeries), 400, 300, 0, 0, FarPoint.Win.Chart.ChartViewType.View3D, false); |
|
| VB |
Copy Code
|
|---|---|
fpSpread1.Sheets(0).Cells(0, 1).Value = "c1" fpSpread1.Sheets(0).Cells(0, 2).Value = "c2" fpSpread1.Sheets(0).Cells(0, 3).Value = "c3" fpSpread1.Sheets(0).Cells(1, 0).Value = "s1" fpSpread1.Sheets(0).Cells(2, 0).Value = "s2" fpSpread1.Sheets(0).Cells(3, 0).Value = "s3" fpSpread1.Sheets(0).Cells(4, 0).Value = "s4" fpSpread1.Sheets(0).Cells(5, 0).Value = "s5" fpSpread1.Sheets(0).Cells(6, 0).Value = "s6" fpSpread1.Sheets(0).Cells(1, 1).Value = 1 fpSpread1.Sheets(0).Cells(2, 1).Value = 2 fpSpread1.Sheets(0).Cells(3, 1).Value = 3 fpSpread1.Sheets(0).Cells(4, 1).Value = 4 fpSpread1.Sheets(0).Cells(5, 1).Value = 5 fpSpread1.Sheets(0).Cells(6, 1).Value = 6 fpSpread1.Sheets(0).Cells(1, 2).Value = 7 fpSpread1.Sheets(0).Cells(2, 2).Value = 8 fpSpread1.Sheets(0).Cells(3, 2).Value = 9 fpSpread1.Sheets(0).Cells(4, 2).Value = 10 fpSpread1.Sheets(0).Cells(5, 2).Value = 11 fpSpread1.Sheets(0).Cells(6, 2).Value = 12 fpSpread1.Sheets(0).Cells(1, 3).Value = 13 fpSpread1.Sheets(0).Cells(2, 3).Value = 14 fpSpread1.Sheets(0).Cells(3, 3).Value = 15 fpSpread1.Sheets(0).Cells(4, 3).Value = 16 fpSpread1.Sheets(0).Cells(5, 3).Value = 17 fpSpread1.Sheets(0).Cells(6, 3).Value = 18 Dim range As New FarPoint.Win.Spread.Model.CellRange(0, 0, 7, 4) fpSpread1.Sheets(0).AddChart(range, GetType(FarPoint.Win.Chart.BarSeries), 400, 300, 0, 0, FarPoint.Win.Chart.ChartViewType.View3D, False) |
|
Using Code
You can add a chart control to the Spread control using code. This example creates a chart control, adds data to the chart control, and then adds the chart control to Spread.
Example
This example has code for the Add method used to add a chart control to Spread and the Model property used for the chart control outside of the Spread control.
| C# |
Copy Code
|
|---|---|
FarPoint.Win.Chart.BarSeries series = new FarPoint.Win.Chart.BarSeries(); series.Values.Add(2.0); series.Values.Add(4.0); series.Values.Add(3.0); series.Values.Add(5.0); FarPoint.Win.Chart.YPlotArea plotArea = new FarPoint.Win.Chart.YPlotArea(); plotArea.Location = new PointF(0.2f, 0.2f); plotArea.Size = new SizeF(0.6f, 0.6f); plotArea.Series.Add(series); FarPoint.Win.Chart.LabelArea label = new FarPoint.Win.Chart.LabelArea(); label.Text = "Bar Chart"; label.Location = new PointF(0.5f, 0.02f); label.AlignmentX = 0.5f; label.AlignmentY = 0.0f; FarPoint.Win.Chart.LegendArea legend = new FarPoint.Win.Chart.LegendArea(); legend.Location = new PointF(0.98f, 0.5f); legend.AlignmentX = 1.0f; legend.AlignmentY = 0.5f; FarPoint.Win.Chart.ChartModel model = new FarPoint.Win.Chart.ChartModel(); model.LabelAreas.Add(label); model.LegendAreas.Add(legend); model.PlotAreas.Add(plotArea); //How to add the Chart to Spread, requires the chart assembly //FarPoint.Win.Spread.Chart.SpreadChart chart = new FarPoint.Win.Spread.Chart.SpreadChart(); //chart.Size = new Size(200, 200); //chart.Location = new Point(100, 100); //chart.Model = model; //fpSpread1.Sheets[0].Charts.Add(chart); //Or //How to use the chart outside of Spread, requires a chart control //fpChart1.Model = model; |
|
| VB |
Copy Code
|
|---|---|
Dim series As New FarPoint.Win.Chart.BarSeries() series.Values.Add(2.0) series.Values.Add(4.0) series.Values.Add(3.0) series.Values.Add(5.0) Dim plotArea As New FarPoint.Win.Chart.YPlotArea() plotArea.Location = New PointF(0.2F, 0.2F) plotArea.Size = New SizeF(0.6F, 0.6F) plotArea.Series.Add(series) Dim label As New FarPoint.Win.Chart.LabelArea() label.Text = "Bar Chart" label.Location = New PointF(0.5F, 0.02F) label.AlignmentX = 0.5F label.AlignmentY = 0.0F Dim legend As New FarPoint.Win.Chart.LegendArea() legend.Location = New PointF(0.98F, 0.5F) legend.AlignmentX = 1.0F legend.AlignmentY = 0.5F Dim model As New FarPoint.Win.Chart.ChartModel() model.LabelAreas.Add(label) model.LegendAreas.Add(legend) model.PlotAreas.Add(plotArea) 'How to add the Chart to Spread, requires the chart assembly 'Dim chart As New FarPoint.Win.Spread.Chart.SpreadChart() 'chart.Size = New Size(200, 200) 'chart.Location = New Point(100, 100) 'chart.Model = model 'fpSpread1.Sheets(0).Charts.Add(chart) 'Or 'How to use the chart outside of Spread, requires a chart control 'fpChart1.Model = model; |
|