In this topic, you first need to Create a LightSwitch for HTML Project and then Connect to an External OData Service.
In order to instantiate a screen template for the D3 Timeline, you need to add a new Browse screen to your project by implementing the following steps.
- In Solution Explorer, expand your HTMLClient project, right-click on the Screens folder and select Add Screen. The Add New Screen dialog box appears.
- In the Add New Screen dialog box select Browse Data Screen and enter D3TimeLine for the Screen Name and select DemoServiceData.NormalTemperatures from the Screen Data dropdown listbox, then choose OK. The D3Timeline.lsml is added to the Screens folder.
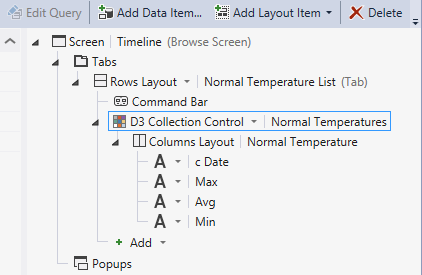
- In the D3Timeline.lsml click on the dropdown arrow next to the List control and choose D3 Collection Control.
- Reorder the properties according to the properties expected by the control. The properties should appear in the following order.
- On the D3Treemap.lsml page click on the link, Edit Query.
- Expand the Sort node and click Add Sort, then set the Sort by to c_Date in Ascending order.
- Click the link Back to D3Timeline.
- On the D3Treemap.lsml page select the D3 Collection Control and expand the General node in the Properties window, then scroll down to the Widget property and set it to Timeline.
- Click Edit Render Code in the Properties window to automatically create the following Javascript code.
JavaScript Copy Codemyapp.Timeline.NormalTemperature_render = function (element, contentItem) { var div = $("<div/>"); div.appendTo($(element)); var options = { width: 600, height: 400 }; var timeline = d3ls.timeline(element, contentItem, options); }; - In the Solution Explorer, right-click on the Timeline.lsml file and select Set as Home Screen.
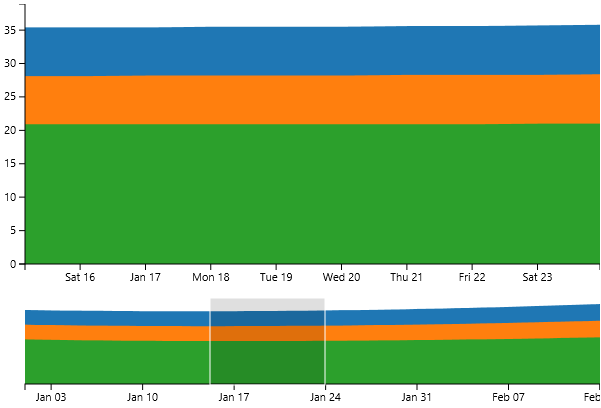
- Run the project and see how the Timeline control appears. Notice how moving the slider rectangle at the bottom of the Timeline chart changes the range displayed at the top of the chart.