You can create a page report that contains a map using the ActiveReports Map control. The Map data region shows your data on a geographical background. This walkthrough illustrates how to create a report that uses a Map to display data.
The walkthrough is split into the following activities:
- Adding an ActiveReport to a Visual Studio project
- Connecting the report to a data source
- Adding a dataset
- Adding Map control to the report and configuring its data
- Configuring appearance of the Map
- Viewing the report
Note:
- This walkthrough use tables from the Reels database. By default, in ActiveReports, the Reels.mdb file is located in the [User Documents folder]\GrapeCity Samples\ActiveReports 12\Data folder.
- Although this walkthrough uses Page reports, you can also implement this using RDL reports.
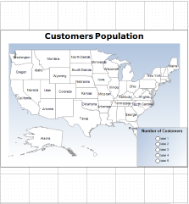
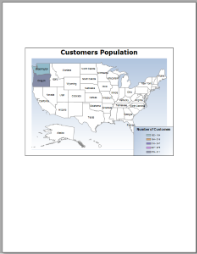
When you complete this walkthrough you get a layout that looks similar to the following at design time and at run time.
Design-Time Layout
Run-Time Layout
To add an ActiveReport to the Visual Studio project
- Create a new Visual Studio project.
- From the Project menu, select Add New Item.
- In the Add New Item dialog that appears, select ActiveReports 12 Page Report and in the Name field, rename the file to CustomersPopulation.
- Click the Add button to open a new fixed page report in the designer.
See Adding an ActiveReport to a Project for information on adding different report layouts.
To connect the report to a data source
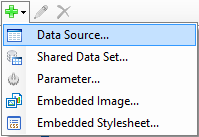
- In the Report Explorer, right-click the Data Sources node and select the Add Data Source option or select Data Source from the Add button.
- In the Report Data Source Dialog that appears, select the General page and in the Name field, enter a name like ReportData.
- On this page, create a connection to the Reels database. See Connect to a Data Source for information on connecting to a data source.
To add a dataset
- In the Report Explorer, right-click the data source node and select the Add Data Set option or select Data Set from the Add button.
- In the DataSet Dialog that appears, select the General page and enter the name of the dataset as Customers. This name appears as a child node to the data source icon in the Report Explorer.
- On the Query page of this dialog, in the Query field enter the following SQL query.
SQL Query Copy CodeSELECT Address.Region, Customer.CustomerID FROM (Address INNER JOIN Person ON Address.[AddressID] = Person.[AddressID]) INNER JOIN Customer ON Person.[PersonID] = Customer.[PersonID];
- Click the Validate DataSet icon at the top right hand corner above the Query box to validate the query.

- Click OK to close the dialog. Your data set and queried fields appear as nodes in the Report Explorer.
To add a Map data region and configure its data
- From the Visual Studio toolbox, drag and drop a Map control onto the design surface.
- In the Select a Map Template wizard that appears, select the USA Map template.
- Click the Map until the map panes appear.
- In the layers pane, right click PolygonLayer1 and select Layer Data to open Map Layer Data Properties dialog.
- In the Map Layer Data Properties dialog that appears, go to the Analytical data page.
- Select Customers from the Dataset property combo box and then click the Add (+) button located next to the Match label. This creates an empty match item and enables its Spatial and Analytical fields editor.
Note: It is necessary to set match fields if you want to use a spatial data field from analytical data, or if you want to visualize analytical data on the map layer. Match fields enable the report processor to build a relationship between the analytical data and the spatial data.
- In the Spatial field property, select
STATE_ABBRfrom the combo box; and similarly, select=Fields!Region.Valuein the Analytical field property. This builds the match field expression and relates the analytical data to map elements on a polygon layer. - Click OK to close the dialog.
To configure appearance of the Map
- In the layers pane, right click PolygonLayer1 and select Edit to open Map Polygon Layer dialog.
- In the General page of the dialog, select
#STATE_NAMEfrom the Label Text combo box to display as label inside polygons at run time. - Go to the Color Rule page of the dialog, and select Visualize data by using color palette option. This activates the tabs below.
- On the General tab, enter the following expression
=Count([CustomerID])in the Data field property and set Palette property to SemiTransparent. - On the Distribution tab, set the Method property to EqualInterval.
- On the Legends tab, click to select Show in Legend.
- In Legend Name, enter Legend. This name relates to the default legend that appears in the Legend collection.
- Click OK to close the dialog.
- On the design surface, click on the Map control to select it and go to the Properties Window to set the following properties:
Properties
Property Name Property Value BackgroundColor White BackgroundGradientEndColor White BorderStyle Solid ColorScale > Hidden True DistanceScale > Hidden True Location 0in, 0.625in Size 6.5in, 4.75in ViewPort > BackgroundColor LightSteelBlue ViewPort > BackgroundGradientEndColor White ViewPort > BorderStyle None ViewPort > CoordinateSystem Planar ViewPort > Margin > Right 20pt ViewPort > Meridians > Hidden True ViewPort > Parallels > Hidden True ViewPort > View > Zoom 115 - With the Map control selected, go to the Properties window, click the Legends (Collection) property and then click the ellipsis button that appears.
- In the LegendDesigner Collection Editor that appears, under the Members list, select the existing legend and set the following properties:
Properties
Property Name Property Value BackgroundColor LightSteelBlue BackgroundGradientEndColor White Location > DockOutsideViewport False Location > DockPosition RightBottom Title > (Caption) Number of Customers Title > Font Normal, Arial, 10pt, Bold - Click OK to close the dialog.
- With the Map control selected, go to the Properties window, click the Titles (Collection) property and then click the ellipsis button that appears.
- In the MapTitleDesigner Collection Editor that appears, with Title selected in the Members list set the following properties:
Properties
Property Name Property Value (Text) Customers Population Color Black - Click OK to close the dialog.
To view the report
- Click the preview tab to view the report at design time.
OR
- Open the report in the Viewer. See Windows Forms Viewer for further information.