In a Page report, ActiveReports allows you to arrange the OverflowPlaceHolder controls at any location on the same page along with the host data region to build a rich report layout. The following walkthrough demonstrates this by using a Table data region and three OverflowPlaceHolder controls on a single page to create a columnar display.
This walkthrough is split into the following activities:
- Adding an ActiveReport to a Visual Studio project
- Connecting to a the data source
- Adding a dataset
- Creating a columnar layout
- Viewing the report
Note: This topic uses the Movie table in the Reels database. By default, in ActiveReports, the Reels.mdb file is located at [User Documents folder]\GrapeCity Samples\ActiveReports 12\Data\Reels.mdb.
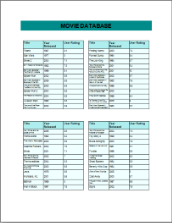
When you complete this walkthrough, you get a report that looks similar to the following:
To add an ActiveReport to the Visual Studio project
- Create a new Visual Studio project.
- From the Project menu, select Add New Item.
- In the Add New Item dialog that appears, select ActiveReports 12 Page Report and in the Name field, rename the file as rptColumnarLayout.
- Click the Add button to open a new fixed page report in the designer.
See Adding an ActiveReport to a Project for information on adding different report layouts.
To connect the report to a data source
- In the Report Explorer, right-click the Data Sources node and select the Add Data Source option or select Data Source from the Add button.
- In the Report Data Source Dialogthat appears, select the General page and in the Name field, enter a name like ColumnData.
- On this page, create a connection to the Reels database. See Connect to a Data Source for information on connecting to a data source.
To add a dataset
- In the Report Explorer, right-click the data source node and select the Add Data Set option or select Data Set from the Add button.
- In the DataSet Dialog that appears, select the General page and enter the name of the dataset as MovieList. This name appears as a child node to the data source icon in the Report Explorer.
- On the Query page of this dialog, in the Query field enter the following SQL query.
SQL Query Copy CodeSELECT * FROM Movie
- Click the Validate DataSet icon at the top right hand corner above the Query box to validate the query.

- Click OK to close the dialog. Your data set and queried fields appear as nodes in the Report Explorer.
To create a layout for the report
- In the Visual Studio toolbox, go to ActiveReports 12 Page Report tab and drag a TextBox control onto the design surface.
- Select the TextBox control and go to the properties window to set the following properties. This TextBox functions as the title in the report layout.
Property Name Property Value Location 0in, 0in BackgroundColor DarkCyan Font Normal, Arial, 20pt, Bold Size 6.5in, 0.5in TextAlign Center Value Movie Database VerticalAlign Middle - From the Visual Studio toolbox, drag and drop a Table data region onto the design surface and set its following properties in the properties window.
Property Name Property Value Location 0.125in, 1in BackgroundColor Azure RepeatHeaderOnNewPage True Size 3in, 0.66in FixedSize 3in, 3.5in OverflowName OverflowPlaceHolder1 Note: Set this property after you add the OverflowPlaceHolder1 to the design surface in the next step, to handle the data that exceeds the fixed size of the Table data region. - In the table details row, add the following fields using the field selection adorner:
Cell Field Name Left Title Center YearReleased Right UserRating - In the table details row, select the left cell containing the Title field and go to the Properties window to set the ShrinkToFit property to True. This will avoid clipping of longer movie titles and fit the string in the same cell in a smaller font size.
- In the design view, select the following rows of the Table data region by clicking the table handle to the left of the row and go to the Properties window to set the following properties:
Row Property Name TableHeader BackgroundColor: PaleTurquoise
BorderStyle: Solid
FontSize: 10pt
FontWeight: Bold
TextAlign: LeftTableDetail BorderStyle: Solid
TextAlign: Left
FontSize: 9pt - From the Visual Studio toolbox, drag and drop three OverflowPlaceHolder controls onto the design surface and the set the following properties in the Properties window for each of them so that the data appears in a columnar format.
Control Name Property OverflowPlaceHolder1 Location: 3.375in, 1in
OverflowName: OverflowPalceHolder2Note: Set this property after you add the OverflowPlaceHolder2 to the design surface.OverflowPlaceHolder2 Location: 0.125in, 5in
OverflowName: OverflowPlaceHolder3Note: Set this property after you add the OverflowPlaceHolder3 to the design surface.OverflowPlaceHolder3 Location: 3.375in, 5in Note: Notice that the OverflowName property is set to link each OverflowPlaceHolder control to the next one.
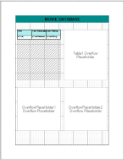
Once you have completed the steps above, you get a layout that looks similar to the following at design time. This is the same layout that you see on preview or at run time.
To view the Report
- Click the preview tab to view the report.
OR
- See Windows Forms Viewer to display report in the Viewer at run time.
Notice that the report layout is similar to the one you saw at design time except for the data which is added to the report on preview or at run time.
See Also