We have made a number of changes and added new features since the last version of ActiveReports. Following are some of the major highlights of this release.
UserContext in Design Mode (Page and RDL reports)
Now you can create a dynamic connection string for a Server Shared Data Source using the UserContext attribute. You can also create dynamic queries in a Server Shared Data Set.
Expressions in the Jump to report field (Page and RDL reports)
ActiveReports now allows you to use expressions in the Jump to report field to create dynamic drill-through links.
Automatic Cell Merge
We have a new AutoMerge property for the Table cells in Details section and Tablix cells outside RowGroup. Using this property, the consecutive cells containing same data value are automatically merged.
Embedded Dataset Based on Server Shared Data Source
Now you can create a Page or an RDL report with an embedded dataset based on a server shared data source.
To add a shared data source to your report on ActiveReports, you can select a new option From Server... in the Reference field and choose a server shared data source from the list in the Server Shared Data Sources dialog. You can use the selected server shared data source to create an embedded dataset for your report, just like any other regular data set. With this new improvement, you don't have to publish a dataset on the Server each time you create a report with a server shared data source.
New View Modes in HTML5 Viewer
The HTML5 Viewer features new view modes - Single page view and Continuous page view. These view modes are available for both Desktop and Mobile UI types.
Improved Multi-Value Parameter Selection
The new Value for 'Select All' property for multi-value parameters lets user specify a special value to the parameter value, which is especially useful when there are many values in the parameter to choose from and selecting all options generates a large query.
Improved Performance
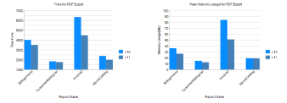
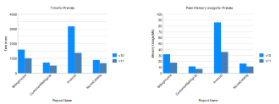
ActiveReports 11 is faster than any of the earlier versions with an optimized rendering process. We have refactored the report engine using latest technologies to improve all round performance for small reports as well as the large (1000+ pages) reports. The improved report engine has following features:
- 2x Faster first page load times.
- 1.5x Faster PDF export file generation.
- 60% Smaller peak memory footprint.
Support for Visual Studio 2017
ActiveReports 11 is now fully integrated into the new Visual Studio 2017 IDE.
Improved HTML5 Viewer
High quality viewing experience
We have made tremendous improvements to the report preview experience in our HTML5 viewer. We now draw charts using Scalable Vector Graphics (SVG) technology that allows us to keep them looking smooth even when you zoom in on them on high-resolution devices.
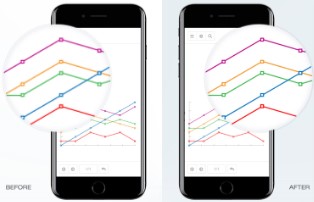
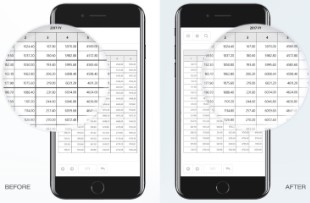
We have also significantly improved the precision of table, matrix, and tablix borders in the HTML5 viewer so that even complex tables look sharp and crisp.
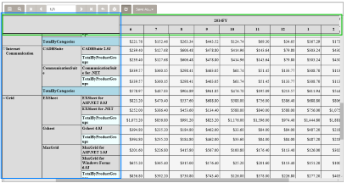
Frozen rows and columns feature
We have added new FrozenRows and FrozenColumns properties on Table and Tablix data regions. These improve your report viewing experience in the HTML5 Viewer in Galley mode. When you have enough data in a data region that the user must scroll to reach the end, the header row or column is no longer in view. The new properties let you freeze as many header rows and columns as you have in the Table or Tablix so that they float when the user scrolls through the data. This enhancement is for RDL reports.
Tooltips in Chart data region
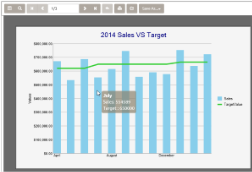
Another enhancement to charts makes for a more interactive report viewing experience. The new Tooltip property lets you enter an expression to display data in tooltip text when the user mouses over chart data in the HTML5 viewer.
Galley Mode in Web and HTML5 Viewers
In ActiveReports, we improved the report preview experience by providing a way to output all of the report contents to a single, scrollable page in Web and HTML5 viewers. This is especially useful in RDL reports when you use the Tablix data region and it expands to accommodate complex data.
JSON Data Provider
These days, the JSON data format has become interwoven in the DNA of the internet. That is why we taught ActiveReports to read JSON data from a number of sources.
- File systems
- Web services
- REST API
For dynamic scenarios, you can supply data at run time. Page and RDL report types support the new JSON data provider. For more information check out the following pages in our product help.
Learn More | Reports with JSON Data
CSV Data Provider
ActiveReports now supports the binding of Section, Page, and RDL reports to data that are stored in text files, such as CSV (comma-separated values), TSV (tab-separated values), and Fixed-Width Values! The rich set of configuration options makes it possible to connect to nearly any text-based data source you can imagine.
Learn More | Reports with CSV Data
Improved XML Provider
We have simplified how you bind Page and RDL reports to an XML data source with a more user-friendly interface. Now you can select a data source from the UI, and use our new XML Query Builder to create your XPath queries!
Learn More | Reports with XML Data
Micro QR Code

We have added a new symbology, Micro QR Code, to the barcode controls in all report types. Compared with the older QR Code symbology, the Micro QR Code takes less real estate on your reports with half the margin required and a single position detection pattern instead of three. Look for special Micro QR Code options in the Properties window.
Composite Chart
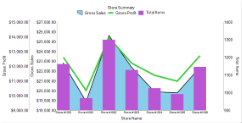
The Page and RDL report Chart data region now allows you to combine multiple graphs of different types within the same plot area so you can present your data in more ways than ever! For example, now you can display the number of items sold and the sales dollar figures in the same chart by using two plots and two Y axes. The following chart types are supported in composite charts.
- Column: Plain, Stacked, Percent Stacked
- Area: Plain, Stacked, Percent Stacked
- Line: Plain, Smooth
PDF Printing Presets
ActiveReports now allows you to preset the number of copies, page range, and other printing properties for PDF report exports, providing more flexibility in one-touch printing and other scenarios.
Learn More | Use PDF Printing Presets
Improved Table and Tablix Usability
ActiveReports 11 brings updates to the table and tablix designers that allow you to easily set the size of rows and columns to perfect your tabular layout!
New Context Menu Item
Text controls are even easier to use now that you can invoke the expression dialog from the context menu.
Excel Import (Page and RDL reports)
We have simplified migration from other reporting tools by adding a new Import from Excel feature. It allows you to easily migrate from XLSX documents marked down with a few simple rules to ActiveReports Page or RDL report layout.
API Enhancements
We have added new properties to the API in ActiveReports 11 to make your life easier.
- PageReportDesignerActions
Lets you specify which designer actions your users can perform on Page reports in the End User Designer control available in the Professional Edition. See the PageReportDesignerActions property in the Class Library for details. - OverwriteOutputFile
Set OverwriteOutputFile to True to replace any existing file of the same name from a Page or RDL report generated using any Rendering Extension. See the OverwriteOutputFile property in the Class Library for details. - OptimizeStatic
Set OptimizeStatic to True to reduce the PDF file size and cut down on the time it takes to export Page reports using PDF Rendering Extension. When True, it recognizes static report items and draws them only once and then re-uses them in subsequent occurrences. See OptimizeStatic property in the Class Library for details.
Lookup Function (Page and RDL reports)
We have added the Lookup function which looks for data specified in any datasets to obtain a value of a specific field. With this new function, you can display multiple datasets in a data region.
See Also