var instance; // Type: wijmo.chart.chart_hint;
var value; // Type: any
value = instance.calloutFilledStyle;
var calloutFilledStyle : any;
var instance; // Type: wijmo.chart.chart_hint; var value; // Type: any value = instance.calloutFilledStyle;
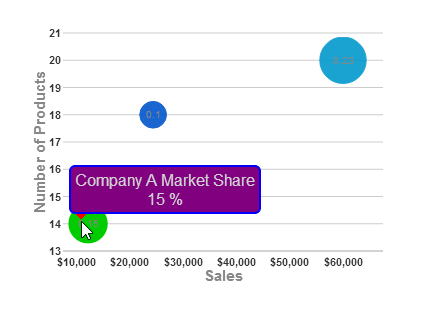
var calloutFilledStyle : any;This example sets the calloutFilled attribute of the hint to true, sets the fill and outline colors of the calloutFilledStyle to red, and sets the style of the hint to purple with a blue outline so that you can easily see the different elements.

<script type="text/javascript">
$(document).ready(function () {
    $("#wijbubblechart").wijbubblechart({
        axis: {
            y: {text: "Number of Products"},
            x: {text: "Sales", annoFormatString: "C0"}
        },
        hint: {
            calloutFilled: true,
            calloutFilledStyle: {fill: "red", stroke: "red"},
            style: {fill: "purple", "stroke-width": "2", stroke: "blue"},
            content: function(){
                return this.data.label + '\n' +
                Globalize.format(this.y1, "p0") + ' ';
            }
        },
        legend: {visible: false},
        seriesList: [
        {
            label: "Company A Market Share",
            data: { y: [14], x: [12200], y1: [.15] }
        }, {
            label: "Company B Market Share",
            data: { y: [20], x: [60000], y1: [.23] }
        }, {
            label: "Company C Market Share",
            data: { y: [18], x: [24400], y1: [.1] }
        }]
    });
});
</script>