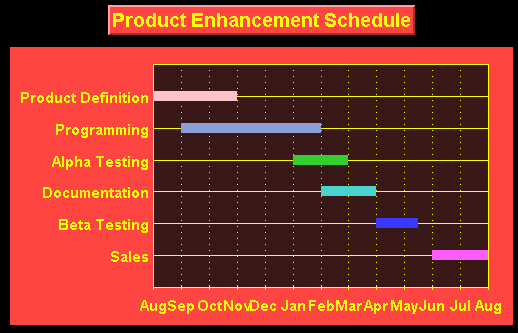
Annotating with ValueLabels
Also, see Axis Annotation Overview.
ValueLabels annotation displays the labels you define at the axis coordinate you specify. This is useful for displaying special text at a specific axis coordinate, or when you need a kind of annotation that the chart does not support. You can set the axis coordinate and the text to display for each ValueLabel, and also add and remove individual ValueLabels. ValueLabels annotation can be used for any axis, with any chart type, and with any data layout, with the following exceptions:
· When used for the X-axis, the chart type cannot be either Pie, Radar or Filled Radar
· When used for the Y-axis, the chart type cannot be Pie

Every label displayed on the axis is one ValueLabel. Each ValueLabel has a Value property and a Label property.
Use the Value property to set the axis coordinate to display the label. Use the Label property to specify the text to display. All ValueLabels properties are located on their own dialog on the Annotation Tab (Axes) on the Property Pages. Set AnnotationMethod to ValueLabels for an axis and click the button beside that property to display the dialog.