The walkthrough illustrates a step-by-step implementation for creating a report using Report Parts to display annual sales of an organization.
The walkthrough is spilt into the following activities:
- Creating an ActiveReports project in Visual Studio
- Creating a layout for the report
- Enhancing the appearance of the report
- Viewing the report
Note:
- This walkthrough uses the SalesReport.rdlx report file. By default, in ActiveReports, the SalesReport.rdlx file is located in the [User Documents folder]\GrapeCity Samples\ActiveReports 13\Reports Gallery\C#\Reports\Page Report\Other.
- Although this walkthrough uses Page reports, you can also implement report parts in RDL and Section reports.
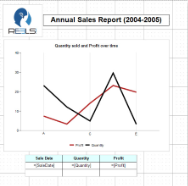
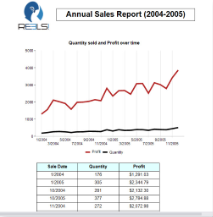
When you complete this walkthrough, you will have a layout that looks similar to the following at design time and at run time.
Design Time Layout
Run-Time Layout
Creating an ActiveReports project in Visual Studio
- Create a new Visual Studio project.
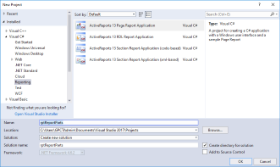
- In the New Project dialog that appears, select ActiveReports 13 Page Report Application and in the Name field, name the file as rptReportParts.
- Click OK to create a new ActiveReports 13 Page Report Application. By default a Page report is added to the project.
See Adding an ActiveReport to a Project for information on adding different report layouts.
Creating a layout for the report
- Select PageReport1.rdlx from the Solution Explorer.
- Open the Reports Library window. For more information on how to open the Reports Library window, see Show or Hide the Reports Library.
- To add a report part from the Reports Library window, right-click the Library node and select Add.
- In the Open dialog that appears, navigate through the GrapeCity Samples folder hierarchy mentioned above and select SalesReport.rdlx. Controls from SalesReport.rdlx are added as Report parts to your Report Library 13 window.
- Drag and drop the salesOverTime chart control from the Reports Library window onto the design surface. The report part is added to your report along with its data sources, data sets and parameters.
- Drag and drop the Image1 image from the Reports Library window onto the design surface.
- From the Visual Studio toolbox, drag and drop a Table data region onto the design surface.
- Hover over TextBox4 to reveal the field selection adorner, click it to display a list of available fields, and select the SaleDate field.
- Hover over TextBox5 to reveal the field selection adorner, click it to display a list of available fields, and select the Quantity field.
- Hover over TextBox6 to reveal the field selection adorner, click it to display a list of available fields, and select the Profit field.
- From the Visual Studio toolbox, drag and drop a Textbox control onto the design surface.
- Select the Textbox to view its properties in the Properties window and enter the text Annual Sales Report (2004-2005) in the Value property.
Enhancing the appearance of the report
When you preview the report at this point, you will notice the data from the fields is displayed in the Table data region. Let us now work on the report appearance to further enhance the layout.
- From the designer, select the Image control and then go to Properties Window to set the following properties.
Property Name Property Value Location 0.095in, 0.156in Size 1.3in, 1.1in - From the designer, select TextBox10 and then go to Properties Window to set the following properties.
Property Name Property Value Location 1.5in, 0.5in Size 4.3in, 0.3in BorderStyle Solid FontWeight Bold TextAlign Center FontSize 16pt - From the designer, select the Chart data region and then go to Properties Window to set the following properties.
Property Name Property Value Location 0.1in, 1.3in Size 6in, 4.125in - From the designer, select the Table data region and then go to Properties Window to set the following properties.
Property Name Property Value Location 1.25in, 5.5in Size 4.25in, 1in FixedSize 4.25in, 3.35in RepeatHeaderOnNewPage True - In the Table data region, select the textbox that contains the following fields and go to the Properties window to set the following properties.
Cell Property Name Property Value Sale Date BackgroundColor LightCyan BorderStyle Solid FontWeight Bold TextAlign Center =[SaleDate] BorderStyle Solid TextAlign Center Quantity BackgroundColor LightCyan BorderStyle Solid FontWeight Bold TextAlign Center =[Quantity] BorderStyle Solid TextAlign Center Profit BackgroundColor LightCyan BorderStyle Solid FontWeight Bold TextAlign Center =[Profit] BorderStyle Solid TextAlign Center Format Currency
Viewing the report
- Click the preview tab to view the report at design time.
OR
- Open the report in the Viewer. See Windows Forms Viewer for further information.