Wijmo UI for the Web
chart_legend Interface
wijmo.chart Namespace : chart_legend Interface

Creates a legend object to display with the chart.

By default, each series that you create in the seriesList is represented by a color in the legend, using the seriesList label that you specify. If you do not specify a label, it is labeled "undefined." If you do not want a series to appear in the legend, you can set the seriesList legendEntry attribute to false.

By default, users can click a legend entry to toggle the data series it represents in the chart. See Clickable Legend for code that allows you to disable this function.

Type: Object

Default:

{
    compass: "east", 
    orientation: "vertical",
    style: {fill: "#none", stroke: "none"}, 
    text: "", 
    textMargin: {left: 2, top: 2, right: 2, bottom: 2},
    textStyle: {fill: "#333", stroke: "none"}, 
    titleStyle: {"font-weight": "bold", fill: "#000", stroke: "none"}, 
    visible: true
}
Example

This code creates a chart with a legend that is positioned below the chart (south), with series labels and colors in a row (horizontal), a grey outline and lighter grey fill (style), has a title that reads "Legend" (text), has 5 pixels of space around the text (textMargin), has series labels in a navy 12-point font (textStyle), and has a green 14-point font title (titleStyle) as in the image below.

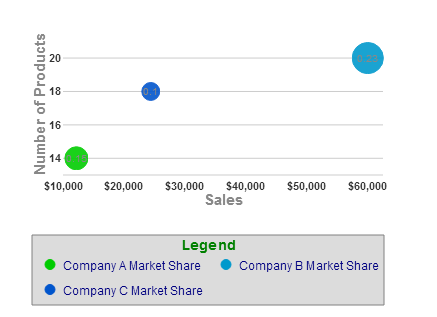
<script type="text/javascript">
$(document).ready(function () {
    $("#wijbubblechart").wijbubblechart({
        axis: {
            y: {text: "Number of Products"},
            x: {text: "Sales", annoFormatString: "C0"}
        },
        legend: {
            compass: "south",
            orientation: "horizontal",
            style: {fill: "gainsboro", stroke: "grey"},
            text: "Legend",
            textMargin: {left: 5, right: 5, top: 5, bottom: 5},
            textStyle: {fill: "navy", "font-size": 12},
            titleStyle: {fill: "green", "font-size": 14}
        },
        seriesList: [
        {
            label: "Company A Market Share",
            data: { y: [14], x: [12200], y1: [.15] }
        }, {
            label: "Company B Market Share",
            data: { y: [20], x: [60000], y1: [.23] }
        }, {
            label: "Company C Market Share",
            data: { y: [18], x: [24400], y1: [.1] }
        }]
    });
});
</script>
Fields
 NameDescription
 Field

A value that indicates where to draw the legend in relation to the chart.

Default: "east"

 
 Field

A value that indicates the orientation of the legend.

Default: vertical

 
 Field

A value that indicates whether to reversed the order of legend list. Set this value to true to reversed the order of legend list.

 
 Field

A value that indicates the size of the legend.

 
 Field

A value that indicates the background color (fill) and border (stroke) of the legend.

Default: {fill:"none", stroke:"none"}

 
 Field

A value that indicates the text to use as the title at the top of the legend.

Default: ""

 
 Field

A value in pixels that indicates the amount of space to leave around the text inside the legend.

Default: {left:2, top:2, right:2, bottom:2}

 
 Field

A value that indicates the style of the series label text. The text values come from the seriesList labels.

Default: {fill:"#333", stroke:"none"}

 
 Field

A value that indicates the width of the legend text in pixels, allowing you to control line break positioning for multi-word legend entries.

Type: Number

Default: null (Finds the width of the widest legend entry.)

 
 Field

A value that indicates the style of the legend title. The text for the title is set in the text attribute of the legend.

Default: {"font-weight": "bold", fill:"#000", stroke:"none"}

 
 Field

A value that indicates whether to show the legend. Set this value to false to hide the legend.

Default: true

 
Top
See Also

Reference

wijmo.chart Namespace