Wijmo UI for the Web
Set Dynamic Chart Sizes
Wijmo User Guide > Widgets > Chart Widgets > BarChart > BarChart How To > Set Dynamic Chart Sizes

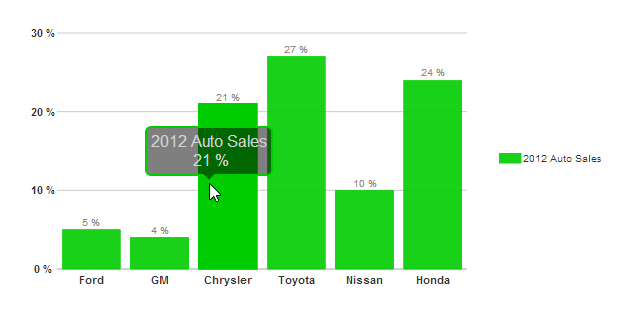
Building on the Quick Start example, and using the concept of getting the number of bars, you can change the height or width of your chart depending on the number of bars to make room for your bar labels.

Note: For this example, we set the horizontal option to false and dynamically change the width of the chart. If you keep the default horizontal value of true, then you can dynamically change the height of the chart instead.
  1. In the <head> section of your HTML file, replace the script that includes the document ready function with this one, which does the following:
    • Sets the header text so that a title appears along the top.
    • Sets the following three labels to use p0 formatting (percentage with no decimals):
    • Changes the orientation of the bars from horizontal to vertical.
    • Creates a series with the following properties:
      • Tooltips display with "2012 Auto Sales" and the data value when you mouse over each bar.
      • A legend displays.
      • The X axis displays major auto manufacturers.
      • The Y axis displays the percentage of increase in sales over the previous year.
    • Creates a variable that gets the number of bars in the chart.
    • Sets the width of the chart area to the number of bars times 100 pixels, and redraws the chart.

    Drop down and copy code

    Round Bar Corners Script
    Copy Code
    <script id="scriptInit" type="text/javascript">
            $(document).ready(function () {
                $("#wijbarchart").wijbarchart({
                    axis:{
                        y:{annoFormatString:"p0"}
                    },
                    chartLabelFormatString: "p0",
                    hint:{
                        content: function(){
                            return this.data.label + '\n ' +  
    
                              Globalize.format(this.y, "p0") + '';
                        }
                    },
                    horizontal: false,
                    seriesList: [{
                        label: "2012 Auto Sales",
                        legendEntry: true,
                        data: { 
                            x: ['Ford', 'GM', 'Chrysler', 'Toyota', 'Nissan', 'Honda'], 
                            y: [.05, .04, .21, .27, .1, .24] 
                        }
                    }],
            });
            // Find the number of bars in the chart.
            var len = $("#wijbarchart").data().fields.chartElements.bars.length;
            // Set the width of the chart, allowing 100 pixels for each bar.
            // Change this to height if you leave the horizontal option at true.
            $("#wijbarchart").width(len*100).wijbarchart("redraw")
        });
    </script>
    
  2. No changes are necessary in the <body> section of your HTML file. The basic <div> tag is sufficient to create the chart.
  3. Save your HTML file and open it in a browser. The chart appears like the one in the image below, with the width growing with the number of bars.
See Also

Reference

Widgets