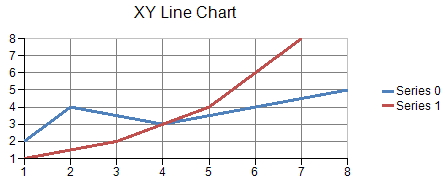
The line chart can be an XY plot such as the one shown in this figure.
An XZ line series can have a border, fill effect, and depth for the line. You can also specify whether the line is jagged or smooth and whether drop lines are displayed. Assigning null for a border or fill effect indicates that the property is unset. Depth is measured relative to the floor grid cell (0 = no depth, 1 = depth of floor grid cell).
For more information on the line series object in the API, refer to the XYLineSeries class.