The XY plot area contains series that have values in two dimensions. When visualized in 2D, an XY plot area takes the form of a rectangle with a horizontal x-axis representing values and a vertical y-axis representing values. When visualized in 3D, the XY plot area takes the form of a cube with a horizontal x-axis representing values, a vertical y-axis representing values, and a depth z-axis representing series.
When a plot area has multiple x-axes or multiple y-axes, a series can be assigned to a specific axis using the axis's ID.
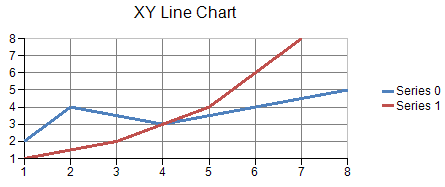
You can have any of these types of XY plots.