You can use the sunburst chart to display hierarchical data. Each hierarchy level is represented by one ring or circle in the chart. The innermost circle is the top of the hierarchy.
The following image displays multiple rings of data.
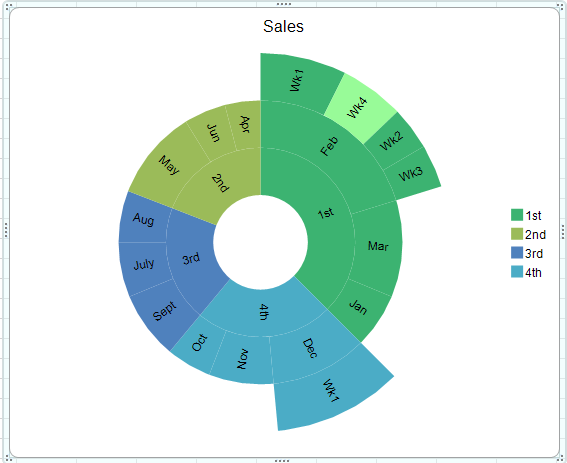
You can use the SunburstSeries and SunburstPlotArea classes to add a sunburst chart.
For information about creating charts in the Spread Designer or the Chart Designer, refer to Adding a Chart Control or Using the Chart Designer.
Using Code
- Add data for the chart.
- Add the chart.
- Set any additional properties such as the fill color.
Example
This example creates a sunburst chart.
| C# |
Copy Code
|
|---|---|
| fpSpread1.ActiveSheet.Cells[0, 0].Text = "Quarter"; fpSpread1.ActiveSheet.Cells[0, 1].Text = "Month"; fpSpread1.ActiveSheet.Cells[0, 2].Text = "Week"; fpSpread1.ActiveSheet.Cells[0, 3].Text = "Sales"; fpSpread1.ActiveSheet.Cells[1, 0].Text = "1st"; fpSpread1.ActiveSheet.Cells[1, 1].Text = "Jan"; fpSpread1.ActiveSheet.Cells[1, 3].Value = 1.7; fpSpread1.ActiveSheet.Cells[2, 1].Text = "Feb"; fpSpread1.ActiveSheet.Cells[2, 2].Text = "Wk1"; fpSpread1.ActiveSheet.Cells[2, 3].Value = 2.0; fpSpread1.ActiveSheet.Cells[3, 2].Text = "Wk2"; fpSpread1.ActiveSheet.Cells[3, 3].Value = 1.0; fpSpread1.ActiveSheet.Cells[4, 2].Text = "Wk3"; fpSpread1.ActiveSheet.Cells[4, 3].Value = 1.0; fpSpread1.ActiveSheet.Cells[5, 2].Text = "Wk4"; fpSpread1.ActiveSheet.Cells[5, 3].Value = 1.5; fpSpread1.ActiveSheet.Cells[6, 1].Text = "Mar"; fpSpread1.ActiveSheet.Cells[6, 3].Value = 3.0; fpSpread1.ActiveSheet.Cells[7, 0].Text = "2nd"; fpSpread1.ActiveSheet.Cells[7, 1].Text = "Apr"; fpSpread1.ActiveSheet.Cells[7, 3].Value = 1.1; fpSpread1.ActiveSheet.Cells[8, 1].Text = "May"; fpSpread1.ActiveSheet.Cells[8, 3].Value = 2.8; fpSpread1.ActiveSheet.Cells[9, 1].Text = "Jun"; fpSpread1.ActiveSheet.Cells[9, 3].Value = 1.3; fpSpread1.ActiveSheet.Cells[10, 0].Text = "3rd"; fpSpread1.ActiveSheet.Cells[10, 1].Text = "July"; fpSpread1.ActiveSheet.Cells[10, 3].Value = 1.7; fpSpread1.ActiveSheet.Cells[11, 1].Text = "Aug"; fpSpread1.ActiveSheet.Cells[11, 3].Value = 1.6; fpSpread1.ActiveSheet.Cells[12, 1].Text = "Sept"; fpSpread1.ActiveSheet.Cells[12, 3].Value = 2.1; fpSpread1.ActiveSheet.Cells[13, 0].Text = "4th"; fpSpread1.ActiveSheet.Cells[13, 1].Text = "Oct"; fpSpread1.ActiveSheet.Cells[13, 3].Value = 1.4; fpSpread1.ActiveSheet.Cells[14, 1].Text = "Nov"; fpSpread1.ActiveSheet.Cells[14, 3].Value = 2.0; fpSpread1.ActiveSheet.Cells[15, 1].Text = "Dec"; fpSpread1.ActiveSheet.Cells[15, 2].Text = "Wk1"; fpSpread1.ActiveSheet.Cells[15, 3].Value = 3.0; fpSpread1.ActiveSheet.AddChart(new FarPoint.Win.Spread.Model.CellRange(0, 0, 16, 4), typeof(FarPoint.Win.Chart.SunburstSeries), 550, 450, 300, 0); FarPoint.Win.Chart.SunburstSeries sunseries = (FarPoint.Win.Chart.SunburstSeries)fpSpread1.Sheets[0].Charts[0].Model.PlotAreas[0].Series[0]; sunseries.Fills.AddRange(new FarPoint.Win.Chart.Fill[] { new FarPoint.Win.Chart.SolidFill(Color.MediumSeaGreen), null, null, null, null, null, new FarPoint.Win.Chart.SolidFill(Color.PaleGreen), null, null }); |
|
| VB |
Copy Code
|
|---|---|
| fpSpread1.ActiveSheet.Cells(0, 0).Text = "Quarter" fpSpread1.ActiveSheet.Cells(0, 1).Text = "Month" fpSpread1.ActiveSheet.Cells(0, 2).Text = "Week" fpSpread1.ActiveSheet.Cells(0, 3).Text = "Sales" fpSpread1.ActiveSheet.Cells(1, 0).Text = "1st" fpSpread1.ActiveSheet.Cells(1, 1).Text = "Jan" fpSpread1.ActiveSheet.Cells(1, 3).Value = 1.7 fpSpread1.ActiveSheet.Cells(2, 1).Text = "Feb" fpSpread1.ActiveSheet.Cells(2, 2).Text = "Wk1" fpSpread1.ActiveSheet.Cells(2, 3).Value = 2.0 fpSpread1.ActiveSheet.Cells(3, 2).Text = "Wk2" fpSpread1.ActiveSheet.Cells(3, 3).Value = 1.0 fpSpread1.ActiveSheet.Cells(4, 2).Text = "Wk3" fpSpread1.ActiveSheet.Cells(4, 3).Value = 1.0 fpSpread1.ActiveSheet.Cells(5, 2).Text = "Wk4" fpSpread1.ActiveSheet.Cells(5, 3).Value = 1.5 fpSpread1.ActiveSheet.Cells(6, 1).Text = "Mar" fpSpread1.ActiveSheet.Cells(6, 3).Value = 3.0 fpSpread1.ActiveSheet.Cells(7, 0).Text = "2nd" fpSpread1.ActiveSheet.Cells(7, 1).Text = "Apr" fpSpread1.ActiveSheet.Cells(7, 3).Value = 1.1 fpSpread1.ActiveSheet.Cells(8, 1).Text = "May" fpSpread1.ActiveSheet.Cells(8, 3).Value = 2.8 fpSpread1.ActiveSheet.Cells(9, 1).Text = "Jun" fpSpread1.ActiveSheet.Cells(9, 3).Value = 1.3 fpSpread1.ActiveSheet.Cells(10, 0).Text = "3rd" fpSpread1.ActiveSheet.Cells(10, 1).Text = "July" fpSpread1.ActiveSheet.Cells(10, 3).Value = 1.7 fpSpread1.ActiveSheet.Cells(11, 1).Text = "Aug" fpSpread1.ActiveSheet.Cells(11, 3).Value = 1.6 fpSpread1.ActiveSheet.Cells(12, 1).Text = "Sept" fpSpread1.ActiveSheet.Cells(12, 3).Value = 2.1 fpSpread1.ActiveSheet.Cells(13, 0).Text = "4th" fpSpread1.ActiveSheet.Cells(13, 1).Text = "Oct" fpSpread1.ActiveSheet.Cells(13, 3).Value = 1.4 fpSpread1.ActiveSheet.Cells(14, 1).Text = "Nov" fpSpread1.ActiveSheet.Cells(14, 3).Value = 2.0 fpSpread1.ActiveSheet.Cells(15, 1).Text = "Dec" fpSpread1.ActiveSheet.Cells(15, 2).Text = "Wk1" fpSpread1.ActiveSheet.Cells(15, 3).Value = 3.0 fpSpread1.ActiveSheet.AddChart(New FarPoint.Win.Spread.Model.CellRange(0, 0, 16, 4), GetType(FarPoint.Win.Chart.SunburstSeries), 550, 450, 300, 0) Dim sunseries As FarPoint.Win.Chart.SunburstSeries = DirectCast(fpSpread1.Sheets(0).Charts(0).Model.PlotAreas(0).Series(0), FarPoint.Win.Chart.SunburstSeries) sunseries.Fills.AddRange(New FarPoint.Win.Chart.Fill() {New FarPoint.Win.Chart.SolidFill(Color.MediumSeaGreen), Nothing, Nothing, Nothing, Nothing, Nothing, New FarPoint.Win.Chart.SolidFill(Color.PaleGreen), Nothing, Nothing}) |
|
See Also