Spread Windows Forms 12.0 Product Documentation
XYPlotArea Class
Members 


FarPoint.Win.Chart Assembly > FarPoint.Win.Chart Namespace : XYPlotArea Class
Represents an XY plot area in a chart model.
Object Model
XYPlotArea ClassWall ClassWall ClassLightCollection ClassLight ClassProjection ClassSeriesCollection ClassSeries ClassWall ClassValueAxisCollection ClassValueAxis ClassValueAxisCollection ClassValueAxis ClassIndexAxis Class
Syntax
'Declaration
 
Public Class XYPlotArea 
   Inherits PlotArea
'Usage
 
Dim instance As XYPlotArea
public class XYPlotArea : PlotArea 
Remarks
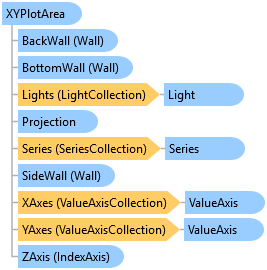
The plot area has an x-axis, a y-axis, a z-axis, and up to six walls. The x-axis and y-axis represent values. The z-axis represents series.
Inheritance Hierarchy

System.Object
   FarPoint.Win.Chart.PlotArea
      FarPoint.Win.Chart.XYPlotArea

See Also

Reference

XYPlotArea Members
FarPoint.Win.Chart Namespace