General Tab (ChartGroup)
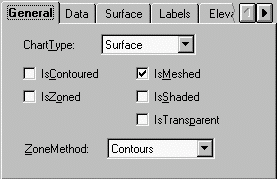
The ChartType dropdown allows you to change the specific type of chart used for each ChartGroup.
Chart3D.ChartGroups.Item(ii).ChartType
When selected (checked), the IsContoured checkbox sets the IsContoured property so that contour lines are drawn on the chart.
Chart3D.ChartGroups.Item(ii).Contour.IsContoured
When selected (checked), the IsMeshed checkbox sets the IsMeshed property so mesh lines are drawn on the chart.
Chart3D.ChartGroups.Item(ii).Elevation.IsMeshed
When selected (checked), the IsZoned checkbox sets the IsZoned property so that zone colors are drawn on the chart.
Chart3D.ChartGroups.Item(ii).Contour.IsZoned
When selected (checked), the IsShaded checkbox sets the IsShaded property so that surface shading is drawn on the chart.
Chart3D.ChartGroups.Item(ii).Elevation.IsShaded
When selected (checked), the IsTransparent checkbox sets the IsTransparent property so that the chart mesh is transparent.
Note: This property is displayed when the IsShaded property is not used.
Chart3D.ChartGroups.Item(ii).Elevation.IsTransparent
The ZoneMethod dropdown allows you to specify how to determine each zone region.
Note: This property is displayed when the IsZoned property is used.
Chart3D.ChartGroups.Item(ii).Contour.ZoneMethod
For more information, see Choosing the Chart Type and Modifying the Surface Appearance.