Choosing the Chart Type
The 3D Chart displays data as a 3D surface chart, a 3D bar chart, or a 3D scatter plot. Use the ChartType property to specify whether to display data as a surface chart, bar chart, or scatter plot. The ChartType property is located on the General Tab (ChartGroup) on the Property Pages.
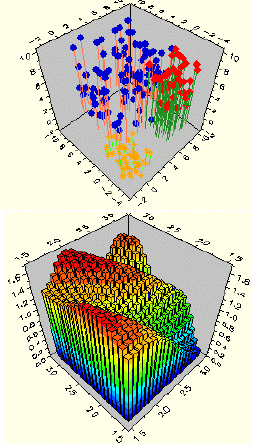
For more information on 3D Bar charts, see Special Bar Chart Properties. For more information on 3D Scatter plots, see Special Scatter Plot Properties.
 3D Bar and 3D Surface Charts