Creating Histogram Bar Charts
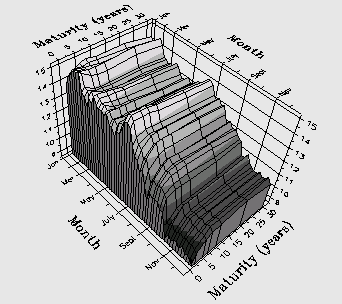
3D bar charts typically display the values along an axis in a fixed format. You can display one or more axes in a histogram format. Histograms may (but usually do not) use an irregular data layout. There is always one less bar because the row/column delta is used for the width of each bar. You can display a bar chart in a histogram format along either the X- or Y-axis.

To Display a Histogram
1. Set the ChartType property to Bar. The ChartType property is located on the General Tab (ChartGroup) on the Property Pages.
2. Use the bar RowFormat and ColumnFormat properties to set the display format of the X- and Y-axes respectively. Both RowFormat and ColumnFormat can be either fixed or histogram. These properties are located on the ChartGroup Page Bar Tab on the Property Pages.