To create a Chart for LightSwitch application, start by creating a new LightSwitch application, and then add a data source and Chart Screen.
Step 1: Create a Chart for LightSwitch project
To create a new Chart for LightSwitch project, complete the following steps:
- In Visual Studio, select File | New Project.
- Under Installed Templates, select LightSwitch. The .NET Framework 4 must be selected in order to create a LightSwitch application.
- Choose LightSwitch Application for the preferred language, enter a name for the application, and click OK. Your LightSwitch project is created. You'll notice it contains the Data Sources and Screens folders.
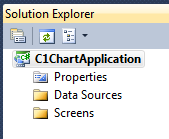
- In the Solution Explorer, right-click the project node and select Properties.
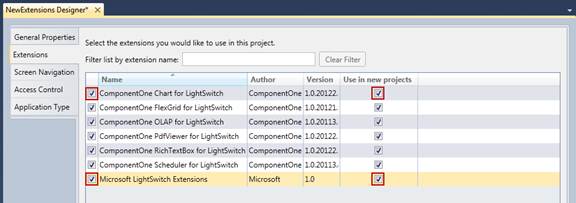
- In the Properties window, select the Extensions tab and make sure the Microsoft LightSwitch Extensions and Chart for LightSwitch items are selected. If desired, select the Use in new projects fields.
Step 2: Add a Data Source
To add an existing data source to the project, follow these steps:
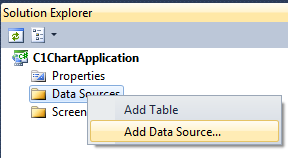
- In the designer, click Attach to external data source. You can also right-click the Data Sources folder in the Solution Explorer and select Add Data Source.
- In the Attach Data Source Wizard, select Database and click Next.
- Choose Microsoft SQL Server and click Continue.
- Enter a server name, select the database name, and click OK.
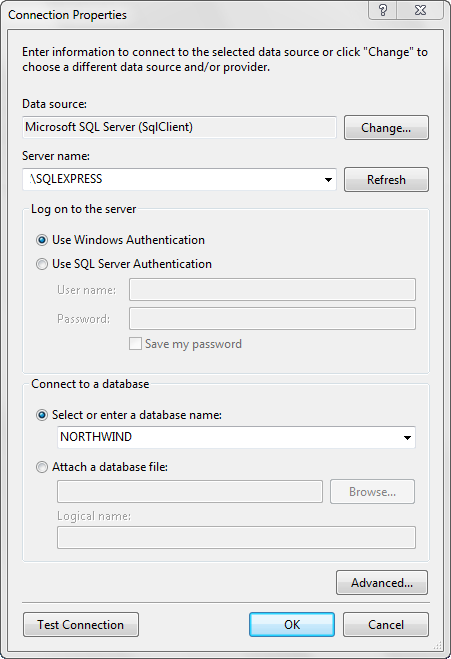
- Open the Views list and select the Product Sales for 1997 check box.
- Click Finish.
Step 3: Add a Chart Screen
- In the Designer, click the Screen button or right-click the Screens folder in the Solution Explorer and choose Add Screen. The Add New Screen window opens.
- Select Chart Screen.
- Under Provide screen information, select NORTHWINDData.Product.Sales_for_1997 from the Screen Data drop-down list. The Screen Name is updated based on the data chosen. The C1ChartPage extension is automatically added to the screen and bound to the selected data.
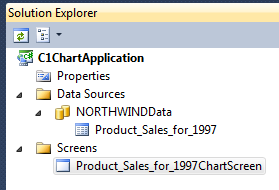
The Solution Explorer will look like this:
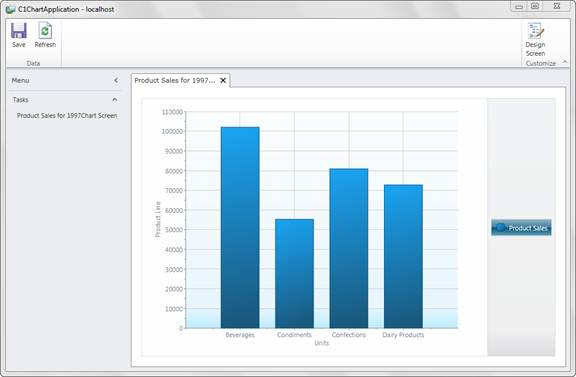
Run the application. It will look like this (The Chart Type is set to Column by default.):
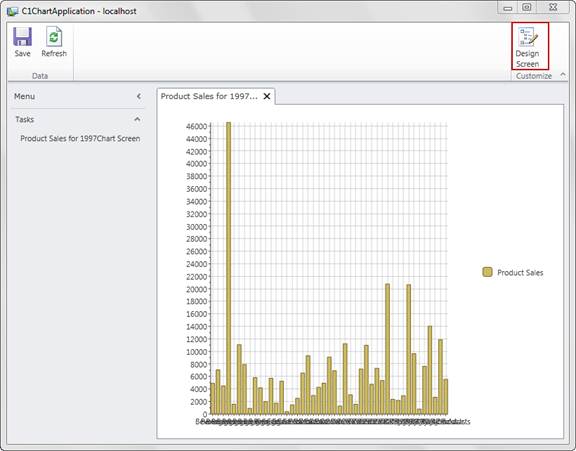
In debug mode, you can click the Design Screen button to customize the page. If you select the C1ChartPage from the left-side menu at run time, you can customize various properties, including options specific to ComponentOne's product. In release mode, the Design Screen button is not available.
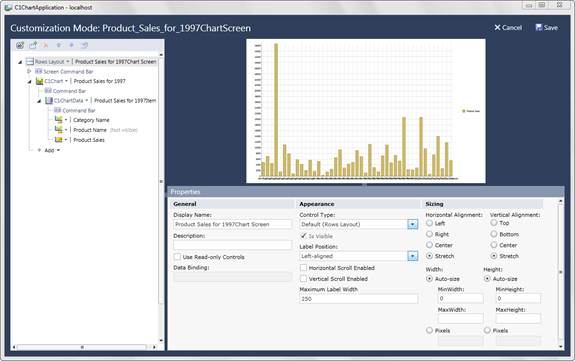
Now we can customize the Chart further. Click the Cancel button at the top right in Customization Mode to return to the Chart.
Step 4: Customizing the Chart
To customize the Chart, follow these steps:
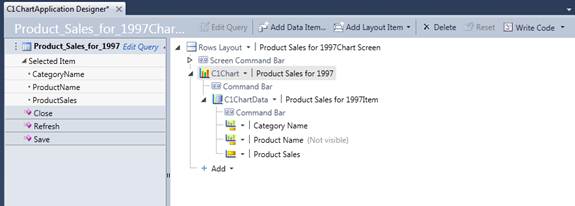
- In the Designer, click on the C1Chart node.
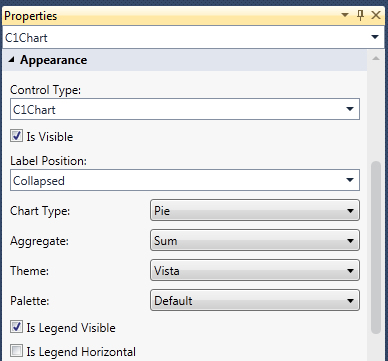
- In the Properties, Change the:
- Chart Type to Pie
- Aggregate to Sum (This will combine the sales of each type of product together.)
- Theme to Vista
- Run the application:
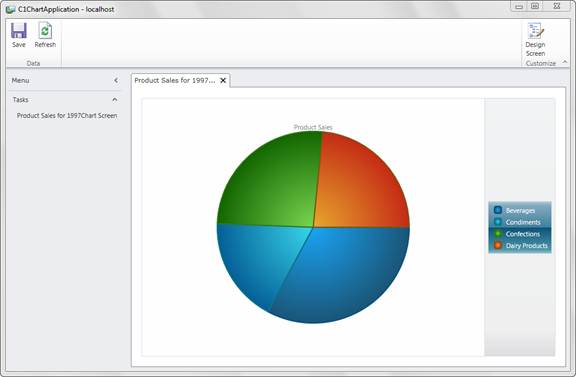
Now you have a Pie chart that clearly summarizes the Product Sales. If you would prefer that the sales amounts be displayed, make the following changes:
- Change the Chart Type back to Column.
- In the X Title field, enter Categories.
- In the Y Axis Title field, enter Product Sales.
Now our chart clearly displays sales figures, and both axes have labels.
