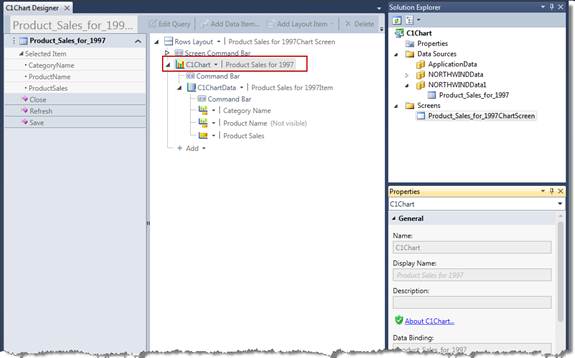
Following are the design time properties available for the C1Chart-specific elements in the screen designer. All of the C1Chart options appear in the General, Appearance, and Sizing groups.
Click on the node containing the C1Chart to reveal the available Properties.

General
Name — The name used to refer to the control form code.
Display Name — The name that will be displayed in the label for the control.
Description — If desired, enter more information about the control.
Data Binding — The database field or screen property C1Chart obtains data from.
Appearance
Control Type — C1Chart by default.
Is Visible — If checked, the C1Chart is included in the final screen.
Label Position — Choices are Left-aligned, Right-aligned, Top, Bottom, None, and Collapsed.
Chart Type — See Chart Types for a complete list.
Aggregate — You can create charts that summarize data in a variety of ways. You can perform calculations such as average, sum, and count on your data to show useful summary charts. The available options are:
- None = No aggregation is performed.
- Sum = Sum all values for each point.
- Count = Number of values for each point.
- Average = Average all values for each point.
- Minimum = Get the minimum value for each point.
- Maximum = Get the maximum value for each point.
- Variance = Gets the variance of the values for each point (sample).
- VariancePop = Gets the variance of the values for each point (population).
- StandardDeviation = Gets the standard deviation of the values for each point (sample).
- StandardDeviationPop = Gets the standard deviation of the values for each point (population).
Theme — See Chart Themes and Palettes|topic=Chart Themes and Palettes for a complete list of options.
Palette — See Chart Themes and Palettes|topic=Chart Themes and Palettes for a complete list of options.
Is Legend Visible — If checked, the Legend is included with the Chart.
Is Legend Horizontal — If checked, the Legend is Horizontal rather than Vertical (the default).
Legend Position — Choices are: Left, Right, Top, and Bottom.
X or Y Minimum — You can specify the minimum value to be displayed for X or Y.
X or Y Maximum — You can specify the maximum value to be displayed for X or Y.
X or Y is Time — If checked, the X or Y annotation will be displayed as increments of time.
X or Y Title — Title for the X or Y axis.
X or Y Annotation Format — You can specify the format of the annotations on the X or Y axis using strings, for example: numeric strings http://msdn.microsoft.com/en-us/library/dwhawy9k.aspx.
X or Y Annotation Angle — You can specify the angle of the annotations on the X or Y axis.
Sizing
Horizontal Alignment — The horizontal alignment of the Chart. Choose Left, Right, Center, or Stretch.
Width — The width of the Chart can be set to Auto, you can choose a minimum and maximum width, or you can set the width in pixels.
Vertical Alignment — The vertical alignment of the Chart. Choose Top, Bottom, Center, or Stretch.
Height — The height of the Chart can be set to Auto, you can choose a minimum and maximum height, or you can set the height in pixels.