ComponentOne FlexChart for WinForms
Loading Data from Arrays
FlexChart > Working with FlexChart > Data > Providing Data > Loading Data from Arrays

To load data into FlexChart from a predefined array, you can set the data source of the series by using the DataSource property, which accepts any collection of objects.

You can use the Point array that enables you to set an ordered pair of X and Y coordinates of the integer type in a two dimensional plane. Or you can use the PointF array that lets you set an ordered pair of X and Y coordinates of the floating type in a two dimensional plane.

You can use the Point/PointF array to enter data in case of charts that only use two fields, such as Bar, Column, Scatter, Line, and so on. For charts like Bubble, Candle, and HighLowOpenClose that use more than two fields, you can opt for an alternative method. You can create a data table manually, and then bind the Axis of the chart to the appropriate fields of the data table.

Besides using objects like Point/PointF, you can use an anonymous object array to load data into FlexChart.

Furthermore, there is the SetData() that takes X and Y arrays of the double type. You just need to add a series to FlexChart and pass X and Y arrays of the double type in the SetData() to load data into FlexChart.

For details on adding data to series using the SetData(), refer to Adding Data to Series.

Let's use one of these approaches to load data into FlexChart.

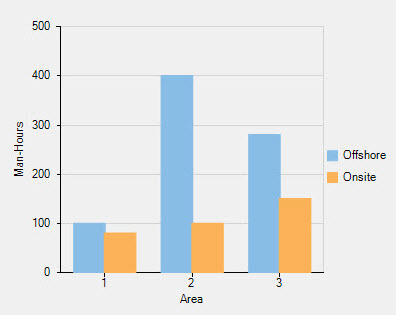
Consider an IT company that is making a software to regulate and maintain banking/financial activities and data for a reputed international bank. There are three primary stages involved in the making of the software: designing (1), coding (2), and testing (3). To carry out these phases, the company undertakes both offshore and onsite activities.

Offshore refers to the work done at the developer's premises, while onsite refers to the work done at the customer's premises.

Apparently, the company wants to analyze the amount of work distribution in terms of man-hours for the software between offshore and onsite activities.

Here's the data table:

Work Distribution Designing (1) Coding (2) Testing (3)
Offshore 100 400 280
Onsite 80 100 150

Since we need to compare the work distribution between offshore and onsite activities, we can use the Column Chart for this scenario.

See the following code for the implementation:

' clear data series collection
FlexChart1.Series.Clear()

' create data series
Dim series1 As New C1.Win.Chart.Series()
Dim series2 As New C1.Win.Chart.Series()

' add data points into the data series
series1.BindingX = "X"
series1.Binding = "Y"
series1.DataSource = New System.Drawing.Point() {
New System.Drawing.Point(1, 100),
New System.Drawing.Point(2, 400),
New System.Drawing.Point(3, 280)}
series1.Name = "Offshore"

series2.BindingX = "X"
series2.Binding = "Y"
series2.DataSource = New System.Drawing.Point() {
New System.Drawing.Point(1, 80),
New System.Drawing.Point(2, 100),
New System.Drawing.Point(3, 150)}
series2.Name = "Onsite"

' add the data series to the data series collection
FlexChart1.Series.Add(series1)
FlexChart1.Series.Add(series2)

' set the chart type to column
FlexChart1.ChartType = C1.Chart.ChartType.Column
// clear data series collection
flexChart1.Series.Clear();

// create data series
C1.Win.Chart.Series series1 = new C1.Win.Chart.Series();
C1.Win.Chart.Series series2 = new C1.Win.Chart.Series();

// add data points into the data series
series1.BindingX = "X";
series1.Binding = "Y";
series1.DataSource = new System.Drawing.Point[] { 
new System.Drawing.Point(1,100),
new System.Drawing.Point(2,400),
new System.Drawing.Point(3,280)};
series1.Name = "Offshore";

series2.BindingX = "X";
series2.Binding = "Y";
series2.DataSource = new System.Drawing.Point[] { 
new System.Drawing.Point(1,80),
new System.Drawing.Point(2,100),
new System.Drawing.Point(3,150)};
series2.Name = "Onsite";

// add the data series to the data series collection
flexChart1.Series.Add(series1);
flexChart1.Series.Add(series2);

// set the chart type to column
flexChart1.ChartType = C1.Chart.ChartType.Column;

Once you have run the code, the following output appears: