ComponentOne FlexChart for WinForms
Adding Data to Series
FlexChart > Working with FlexChart > FlexChart Elements > Series > Adding Data to Series

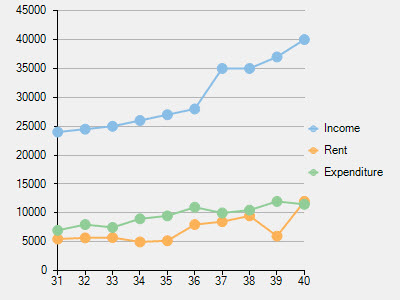
FlexChart allows you to add data to a series easily by using the SetData method of the Series object. The SetData() accepts two arrays of the double type as parameters: one for specifying X values and another for specifying Y values.

Here is the code demonstrating the use of the SetData().

' name the series
series1.Name = "Income"
series2.Name = "Rent"

' add data to the series
series1.SetData(
    New Double() {31, 32, 33, 34, 35,
                  36, 37, 38, 39, 40},
    New Double() {24000, 24500, 25000, 26000, 27000,
                  28000, 35000, 35000, 37000, 40000})
series2.SetData(
    New Double() {31, 32, 33, 34, 35,
                  36, 37, 38, 39, 40},
    New Double() {5500, 5700, 5750, 5000, 5200,
                  8000, 8500, 9500, 6000, 12000})
// name the series
series1.Name = "Income";
series2.Name = "Rent";

// add data to the series
series1.SetData(
    new double[] { 31, 32, 33, 34, 35, 
        36, 37, 38, 39, 40 }, 
    new double[] { 24000, 24500, 25000, 26000, 
        27000, 28000, 35000, 35000, 37000, 40000 });
series2.SetData(
    new double[] { 31, 32, 33, 34, 35, 
        36, 37, 38, 39, 40 }, 
    new double[] { 5500, 5700, 5750, 5000, 
        5200, 8000, 8500, 9500, 6000, 12000 });


You need to clear the Series collection in FlexChart using the Clear() in the FlexChart.Series collection property before plotting series data. If the Series collection is not cleared, the default series entry will still be visible in the Legend. Using the Clear() overrides the default data and plots the provided data on the chart.

You can also add data to a series using the Point array in FlexChart. Refer to Loading Data from Arrays for more details.

When it comes to adding data to series, FlexChart provides even a more powerful way through binding. You can bind series in FlexChart with multiple data sources, which enables you to combine data from multiple data sources. To plot data from multiple data sources, you need to use the Series.DataSource property.

See the following code for reference.

' create series
Dim series1 As New C1.Win.Chart.Series()
Dim series2 As New C1.Win.Chart.Series()
Dim series3 As New C1.Win.Chart.Series()

' add the series
FlexChart1.Series.Add(series1)
FlexChart1.Series.Add(series2)
FlexChart1.Series.Add(series3)

' name the series
series1.Name = "Income"
series2.Name = "Rent"
series3.Name = "Expenditure"

' create a datatable
Dim dt As New DataTable()

' add columns to the datatable
dt.Columns.Add("Age Group", GetType(Integer))
dt.Columns.Add("Expenditure", GetType(Integer))

' add rows to the datatable
dt.Rows.Add(31, 7000)
dt.Rows.Add(32, 8000)
dt.Rows.Add(33, 7500)
dt.Rows.Add(34, 9000)
dt.Rows.Add(35, 9500)
dt.Rows.Add(36, 11000)
dt.Rows.Add(37, 10000)
dt.Rows.Add(38, 10500)
dt.Rows.Add(39, 12000)
dt.Rows.Add(40, 11500)

' add data to the first two series
series1.SetData(New Double() {31, 32, 33, 34, 35, 36, _
    37, 38, 39, 40}, New Double() {24000, 24500, 25000, 26000, 27000, 28000, _
    35000, 35000, 37000, 40000})
series2.SetData(New Double() {31, 32, 33, 34, 35, 36, _
    37, 38, 39, 40}, New Double() {5500, 5700, 5750, 5000, 5200, 8000, _
    8500, 9500, 6000, 12000})

' set dt as the datasource of the third series
series3.DataSource = dt

' bind X-axis and Y-axis of the third series
series3.Binding = "Expenditure"
series3.BindingX = "Age Group"
// create series
C1.Win.Chart.Series series1 = new C1.Win.Chart.Series();
C1.Win.Chart.Series series2 = new C1.Win.Chart.Series();
C1.Win.Chart.Series series3 = new C1.Win.Chart.Series();

// add the series
flexChart1.Series.Add(series1);
flexChart1.Series.Add(series2);
flexChart1.Series.Add(series3);

// name the series
series1.Name = "Income";
series2.Name = "Rent";
series3.Name = "Expenditure";

// create a datatable
DataTable dt = new DataTable();

// add columns to the datatable
dt.Columns.Add("Age Group", typeof(int));
dt.Columns.Add("Expenditure", typeof(int));

// add rows to the datatable
dt.Rows.Add(31, 7000);
dt.Rows.Add(32, 8000);
dt.Rows.Add(33, 7500);
dt.Rows.Add(34, 9000);
dt.Rows.Add(35, 9500);
dt.Rows.Add(36, 11000);
dt.Rows.Add(37, 10000);
dt.Rows.Add(38, 10500);
dt.Rows.Add(39, 12000);
dt.Rows.Add(40, 11500);

// add data to the first two series
series1.SetData(
    new double[] { 31, 32, 33, 34, 35, 
        36, 37, 38, 39, 40 }, 
    new double[] { 24000, 24500, 25000, 26000, 27000, 
        28000, 35000, 35000, 37000, 40000 });
series2.SetData(
    new double[] { 31, 32, 33, 34, 35,
        36, 37, 38, 39, 40 }, 
        new double[] { 5500, 5700, 5750, 5000, 5200, 
            8000, 8500, 9500, 6000, 12000 });

// set dt as the datasource of the third series
series3.DataSource = dt;

// bind X-axis and Y-axis of the third series
series3.Binding = "Expenditure";
series3.BindingX = "Age Group";