The XYPlot type chart is also known as a Scatter plot chart. The following image represents the XYPlot chart when you set C1Chart.ChartType property to XYPlot:
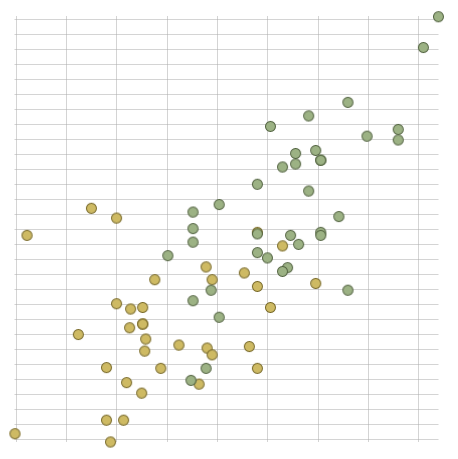
To create a Scatter chart like the one pictured above, use the following XAML markup or code examples:
| XAML |
Copy Code
|
|---|---|
<Chart:C1Chart ChartType="XYPlot" Height="650" Width="750" > <Chart:C1Chart.Data> <Chart:ChartData> <Chart:ChartData.Children> <Chart:XYDataSeries Label="Series 1" XValues="161.4 169.0 166.2 159.4 162.5 159.0 162.8 159.0 179.8 162.9 161.0 151.1 168.2 168.9 173.2 174.0, 162.6 174.0 162.6 161.3 156.2 149.9 169.5 160.0 175.3 169.5 160.0 172.7 162.6 157.5 176.5 164.4 160.7 174.0 163.8" Values="63.4 58.2 58.6 45.7 52.2 48.6 57.8 55.6 66.8, 59.4 53.6 73.2 53.4 69.0 58.4 73.6 61.4 55.5 63.6 60.9 60.0 46.8 57.3 64.1 63.6 67.3 75.5 68.2 61.4 76.8 71.8 55.5 48.6 66.4 67.3 " /> <Chart:XYDataSeries Label="Series 2" XValues="175.0 174.0 165.1 177.0 192.0 176.5 169.4 182.1 179.8 175.3 184.9 177.3 167.4 178.1 168.9 174.0 167.6 170.2 167.6 188.0, 174.0 176.5 180.3 167.6 188.0 180.3 167.6 183.0 183.0 179.1 170.2 177.8 179.1 190.5 177.8 180.3 180.3" Values="70.2 73.4 70.5 68.9 102.3 68.4 65.9 75.7 84.5 87.7 86.4 73.2 53.9 72.0 55.5 70.9 64.5 77.3 72.3 87.3 80.0 82.3 73.6 74.1 85.9 73.2 76.3 65.9 90.9 89.1 62.3 82.7 79.1 98.2 84.1 83.2 83.2" /> </Chart:ChartData.Children> </Chart:ChartData> </Chart:C1Chart.Data> </Chart:C1Chart> |
|
| C# |
Copy Code
|
|---|---|
var ds1 = new XYDataSeries(); { XValuesSource = new double [] {161.4, 169.0, 166.2, 159.4, 162.5, 159.0, 162.8, 159.0, 179.8, 162.9, 161.0, 151.1, 168.2, 168.9, 173.2, 174.0, 162.6, 174.0, 162.6, 161.3, 156.2, 149.9, 169.5, 160.0, 175.3, 169.5, 160.0, 172.7, 162.6, 157.5, 176.5, 164.4, 160.7, 174.0, 163.8}, ValuesSource = { 63.4, 58.2, 58.6, 45.7, 52.2, 48.6, 57.8, 55.6, 66.8, 59.4, 53.6, 73.2, 53.4, 69.0, 58.4, 73.6, 61.4, 55.5, 63.6, 60.9, 60.0, 46.8, 57.3, 64.1, 63.6, 67.3, 75.5, 68.2, 61.4, 76.8, 71.8, 55.5, 48.6, 66.4, 67.3} c1Chart1.Data.Children.Add(ds1); var ds2 = new XYDataSeries(); XValuesSource = new double [] {175.0, 174.0, 165.1, 177.0, 192.0, 176.5, 169.4, 182.1, 179.8, 175.3, 184.9, 177.3, 167.4, 178.1, 168.9, 174.0, 167.6, 170.2, 167.6, 188.0, 174.0, 176.5, 180.3, 167.6, 188.0, 180.3, 167.6, 183.0, 183.0, 179.1, 170.2, 177.8, 179.1, 190.5, 177.8, 180.3, 180.3} ValuesSource = new double [] { 70.2, 73.4, 70.5, 68.9, 102.3, 68.4, 65.9, 75.7, 84.5, 87.7, 86.4, 73.2, 53.9, 72.0, 55.5, 70.9, 64.5, 77.3, 72.3, 87.3, 80.0, 82.3, 73.6, 74.1, 85.9, 73.2, 76.3, 65.9, 90.9, 89.1, 62.3, 82.7, 79.1, 98.2, 84.1, 83.2, 83.2} }; c1Chart1.Data.Children.Add(ds2); c1Chart1.ChartType = ChartType.XYPlot; |
|
| Visual Basic |
Copy Code
|
|---|---|
Dim ds1 As XYDataSeries = New XYDataSeries ds1.XValues = New DoubleCollection From {161.4, 169.0, 166.2, 159.4, 162.5, 159.0, 162.8, 159.0, 179.8, 162.9, 161.0, 151.1, 168.2, 168.9, 173.2,174.0, 162.6, 174.0, 162.6, 161.3, 156.2, 149.9, 169.5, 160.0, 175.3, 169.5, 160.0, 172.7, 162.6, 157.5, 176.5, 164.4, 160.7, 174.0, 163.8 } ds1.Values = New DoubleCollection From {63.4, 58.2, 58.6, 45.7, 52.2, 48.6, 57.8, 55.6, 66.8, 59.4, 53.6, 73.2, 53.4, 69.0, 58.4, 73.6, 61.4, 55.5, 63.6, 60.9, 60.0, 46.8, 57.3, 64.1, 63.6, 67.3, 75.5, 68.2, 61.4, 76.8, 71.8, 55.5, 48.6, 66.4, 67.3 } c1Chart1.Data.Children.Add(ds1) Dim ds2 As XYDataSeries = New XYDataSeries ds2.XValues = New DoubleCollection From {175.0, 174.0, 165.1, 177.0, 192.0, 176.5, 169.4, 182.1, 179.8, 175.3, 184.9, 177.3, 167.4, 178.1, 168.9, 174.0, 167.6, 170.2, 167.6, 188.0, 174.0, 176.5, 180.3, 167.6, 188.0, 180.3, 167.6, 183.0, 183.0, 179.1, 170.2, 177.8, 179.1, 190.5, 177.8, 180.3, 180.3 } ds2.Values = New DoubleCollection From {70.2, 73.4, 70.5, 68.9, 102.3, 68.4, 65.9, 75.7, 84.5, 87.7, 86.4, 73.2, 53.9, 72.0, 55.5, 70.9, 64.5, 77.3, 72.3, 87.3, 80.0, 82.3, 73.6, 74.1, 85.9, 73.2, 76.3, 65.9, 90.9, 89.1, 62.3, 82.7, 79.1, 98.2, 84.1, 83.2, 83.2} c1Chart1.Data.Children.Add(ds2) c1Chart1.ChartType = ChartType.XYPlot |
|
See Also