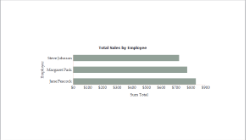
It is very simple to create a chart report using ActiveReports 9 Server.
 |
To create a chart report
- On the ActiveReports 9 Server Report Portal, click New Report
 to create a new report.
 - In the data model list that appears, click ActiveTunes (Sample) to create a report based on the sample data.
- From the Entity Tree to the left of the report design surface, drag the Invoice entity and drop it onto the report.

Note: Drop the entity into the body of the report. If you try to drop the entity into the header area or the margins, a red X icon appears and the action is ignored. - In the selection box that appears, under Select a Chart Type, click Bar. A bar chart is created with the Sum Total per Invoice.
- If they are not already in view, click the chart to reveal the adorners.
- To adjust the position of the chart within the page, click the thumb at the top left corner and drag the chart. For more information about resizing the chart, see Resizing, Moving and Deleting Charts.
- Since the chart at this point would show every invoice with no sorting, add a category and sorting to make the chart more manageable and more meaningful.
- In the Category adorner below the table, drop down the default Invoice value and expand Customer, then Support Rep, and select Full Name.
- Next to Sort on, drop down the (choose) box and expand Customer, then Support Rep, and select Full Name.
- To change the title of the chart, click inside the title box, select the existing text, Sum Total per Invoice, and type Total Sales by Employee.
- To change the Invoice axis label, click inside the label box, select the existing text, Invoice, and type Employee.
- To change the scale of the sales axis to start with zero, click the axis to select it. Three dots appear along the axis to indicate that it's selected.
- On the Chart Design Tools tab, in the Axis section, set the Min value to 0.
- Click Preview to view the completed report.
See Also