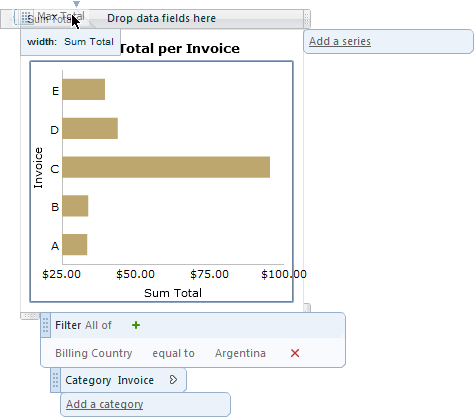
Data fields serve as data points on the chart, determining the width of a bar, the height of a column, or the location and size of a bubble. The default data field is the one you originally drag and drop onto the report design surface to create the chart. You can add more data fields and delete them as necessary.
A single data field shows a single chart element (bar, column, bubble, line, or point) for each category in the chart. Multiple data fields show a chart element for each data field in each category, with the name of each data field displayed in the legend.
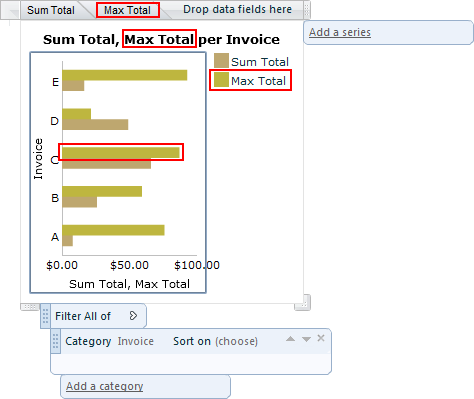
For example, adding a Max Total attribute to an Invoice bar chart adds a bar showing the maximum total above each Sum Total bar. The legend displays different colors or patterns to differentiate the Sum Total and Max Total bars.
To add a new data field
- Click the chart to reveal the adorners.
- Drag an attribute from the Attribute tree and drop it on the data fields area above the chart.
- The new field is displayed alongside the existing data field, along the Y Axis of the chart, and is added to the title and legend.
To delete a data field
- Click the chart to reveal the adorners.
- In the Data Fields area, click to select the data field that you want to delete. The selected field is highlighted.
- On your keyboard, click the Delete key. The data field is removed from the Data Fields area, the field name is removed from the title, and the data points are removed from the Y axis.