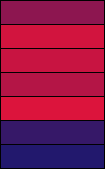
The ColorScale2 data visualization displays a background color in a range of colors to indicate minimum and maximum values, and all shades in between. The Color Scale Data Visualizer is available for TextBox and CheckBox controls.
Parameters
- Value. This is the field value in the report to evaluate. The data type is Single.
- Minimum. If the Value evaluates to this number, the Minimum Color renders.
- Maximum. If the Value evaluates to this number, the Maximum Color renders.
- Minimum Color. The HTML color string to use if the Value evaluates to the Minimum value.
- Maximum Color. The HTML color string to use if the Value evaluates to the Maximum value.
You can use static values or aggregate functions (e.g. Min or Max) to set the Minimum and Maximum parameters.
Syntax
=ColorScale2(Value, Minimum, Maximum, Minimum Color, Maximum Color)
Usage
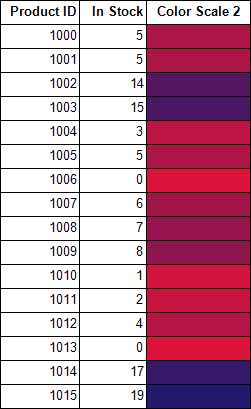
Use an expression with this syntax in the Background - Color property of a Textbox or a CheckBox control. This causes the background color to change depending on the value of the field you specified in the Value parameter, in the case of the example, InStock. Any values falling between the Minimum value and the Maximum render with a color between the Minimum Color and Maximum Color.
Example
Set the Value parameter to the value of a field in your dataset to display the field values visually.
| Paste in the Background - Color property of the TextBox control |
Copy Code
|
|---|---|
=ColorScale2(Fields!InStock.Value,0,20,"Crimson","MidnightBlue") |
|
Default Behavior
The function returns Transparent in any of the following cases:
- The Value is out of range (i.e. does not fall between the Minimum and Maximum values).
- The Maximum is less than the Minimum.
If the argument for any of the parameters cannot be converted to the required data type, the default value is used instead.
| Parameter | Default Value |
|---|---|
| Value | 0 |
| Minimum | 0 |
| Maximum | 0 |
| Minimum Color | Silver |
| Maximum Color | WhiteSmoke |
Dialog
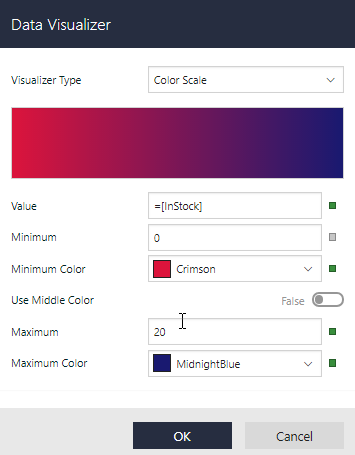
For a TextBox or a CheckBox control on your report, in the Properties pane, go to Background - Color property, select radio button, and then select Data Visualizer... to launch the dialog. To build the data visualizer expression, select the appropriate values for each of the options in the dialog.
Note: If you enable the Use Middle Color option, the expression used in the Background - Color property changes to ColorScale3. For more information, see ColorScale3.
See Also