Bar charts are useful in comparing items across categories. This walkthrough illustrates how to create a simple bar chart using the ActiveReports chart control.
The walkthrough is split up into the following activities:
- Adding a chart control to the report
- Setting a data source for the chart
- Setting the chart's properties
Note: This walkthrough uses the Northwind database. By default, in ActiveReports, the Northwind.mdb file is located at
[User Documents folder]\GrapeCity Samples\ActiveReports 12\Data\NWIND.mdb.
[User Documents folder]\GrapeCity Samples\ActiveReports 12\Data\NWIND.mdb.
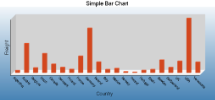
When you complete this walkthrough you get a layout that looks similar to the following at run time.
To add an ActiveReport to the Visual Studio project
- Create a new Visual Studio project.
- From the Project menu, select Add New Item.
- In the Add New Item dialog that appears, select ActiveReports 12 Section Report (code-based) and in the Name field, rename the file as BarChart.
- Click the Add button to open a new section report in the designer.
See Adding an ActiveReport to a Project for information on adding different report layouts.
To add the Chart control to the report
- From the toolbox, drag the Chart data region to the body of the report.
- If the chart wizard appears, click Cancel.
Tip: If you do not want the chart wizard to appear each time you add a chart, clear the Auto Run Wizard checkbox. You can still access the wizard via the command verbs (see below).
- On the design surface, select the grey area outside the report and in the Properties window, set the PrintWidth property to 6.5.
- In the Properties window, set the following properties.
Property Name Property Value Location 0, 0 in Size 6.5, 3.5 in - In the Report Explorer, select Detail1 and go to the properties window to set the Height property to 3.5.
To connect the Chart to a data source
- Select the Chart control and at the bottom of the Properties window, select the Data Source command. See Properties Window for further details on accessing commands.
Tip: If the verb is not visible, right-click an empty space in the Properties Window and select Commands to display verbs.
- In the Chart DataSource dialog box that appears, click the Build button.
- In the Data Link Properties window, select Microsoft Jet 4.0 OLE DB Provider and click the Next button.
- Click the ellipsis button (...) to browse to the Northwind database. Click Open once you have selected the file.
- Click the OK button to close the window and fill in the Connection String.
- In the Query field, enter the following SQL query.
SQL Query Copy CodeSELECT ShipCountry, SUM(Freight) AS FreightSum FROM Orders GROUP BY ShipCountry - Click OK to save the data source.
To configure the appearance of the Chart
- Select the Chart control and at the bottom of the Properties window, select the Customize command. See Properties Window for further details on accessing commands.
- In the Chart Designer dialog that appears set the following.
Chart Areas
- Click the Axes bar on the left to expand it.
- Click Axis X, and on the Common tab in the pane to the right, type Country in the Title textbox and set the Font size to 12.
- On the Labels tab, select the Staggered Labels checkbox to avoid overlapping labels and set the Text angle property to 45.
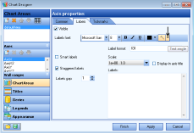
- Click Axis Y on the left, and on the Common tab in the pane to the right, type Freight in the Title textbox and set the Font size to 12.
Titles
- Click the Titles bar on the left to expand it. In the list of titles, the header is selected by default.
- In the Caption textbox, type Simple Bar Chart and increase the Font size to 14.
- In the list of titles to the left, select the footer and delete it by clicking the Delete icon on top of the list.
Series
- Click the Series bar on the left. The Series1 is selected by default.
- In the Data Binding box, set X (Name) to ShipCountry, and set Y to FreightSum.
- In the list of series to the left, select Series2 and Series3 and delete them by clicking the Delete icon on top of the list.
Legend
- Click the Legend bar on the left to expand it. The defaultLegend is selected by default.
- On the Common tab, clear the Visible checkbox to hide the legend.
- Click Finish to exit the Chart Designer.
To view the report
- Click the preview tab to view the report at design time.
OR
- Open the report in the Viewer. See Windows Forms Viewer for further information.
See Also