Note:
- This walkthrough uses the Products and Categories table from the NWIND database. By default, in ActiveReports, the NWIND.mdb file is located in [User Documents folder]\GrapeCity Samples\ActiveReports 12\Data\NWIND.mdb.
- This walkthrough uses Page Reports, but the same steps can be used to generate queries in Rdl or Section reports also. See Accessing the Visual Query Designer, for more information on how to access the Visual Query Designer in Rdl and Section reports.
- Add an ActiveReport to a Visual Studio Project
- Access the Visual Query Designer
- Create a Query
- Save a Query
- View the Report
Add an ActiveReport to a Visual Studio project
- Create a new Visual Studio project.
- From the Project menu, select Add New Item.
- In the Add New Item dialog that appears, select ActiveReports 12 Page Report and in the Name field, rename the file as VisualQueryDesigner.
- Click the Add button to open a new Page Report in the designer.
See Adding an ActiveReport to a Project for information on adding different report layouts.
Access the Visual Query Designer
- Connect a Page Report to a data source. See Connect to a Data Source for details on how to connect to a data source in Page Reports.
- Right-click the data source node (DataSource1 by default) and select the Add Data Set option or select Data Set from the Add button on the Report Explorer toolbar to add a data set to the report.
- In the DataSet Dialog that appears, select the Query page and then select the Edit with visual query designer button
 .
.
This opens the Visual Query Designer.
Create a Query
Visual Query Designer provides you with an interface to reference multiple tables, set up relationships, sort the data and add parameters to your query.
Follow the steps below to create a query like the following using the Visual Query Designer.
Query Result in SQL
| SQL Query |
Copy Code
|
|---|---|
select Products.ProductName, Products.UnitPrice, Categories.CategoryName from Products inner join Categories on Products.CategoryID = Categories.CategoryID where Categories.CategoryName = ? order by Products.UnitPrice desc |
|
Steps to create a Query in Visual Query Designer
- From the Products table in the Database view, drag and drop the fields ProductName and UnitPrice to the Selected Fields panel.
- From the Categories table in Database view, drag and drop the field CategoryName to the Selected Fields panel.
- When you add the field in step 2, a Tables relations dialog automatically appears on the screen.
- In Tables relations dialog, select the Inner Join Type for joining the two tables Products and Categories. The Inner Join tab is selected by default.
Refer to Tables And Relations for more information on types of joins.
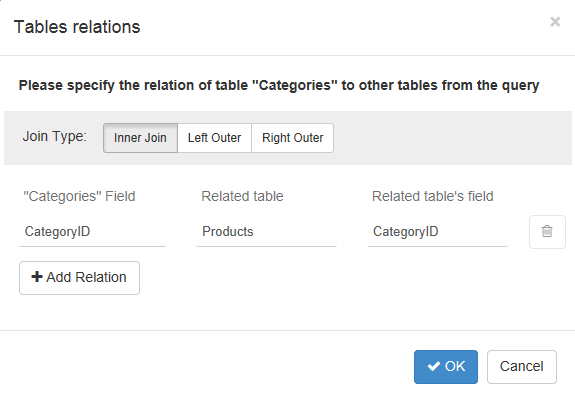
- In Tables relations dialog, click OK to save the relationship between tables.
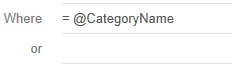
Once the relationship has been set up between tables, you may also access the Tables relations dialog from the Relations button in the Tables and Relationships panel under the Query Tools section. - In the Selected Fields panel under the CategoryName field, select the option Where and set its value to "= @CategoryName". This creates a parameter on the CategoryName field.
- In the Selected Fields panel, go to the UnitPrice field and set the Sort option to descending. This sorts the data in descending order on UnitPrice.
- On the Toolbar of the Visual Query Designer, click the Execute button. A Parameters dialog appears on the screen.
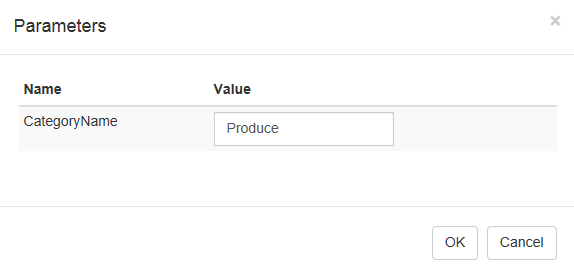
- Enter any parameter value, for example, Produce in the dialog box and click OK.
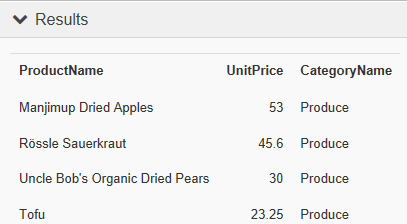
Result data similar to the following appears in Results panel.
Save a Query
- Once your query is created in Visual Query Designer, go to the Toolbar in the Query Tools section of the Visual Query Designer.
- Click the
 button. Your query appears in the Query field of the Query page in the DataSet dialog.
Note: On clicking the Save button, your query is automatically validated by the Visual Query Designer.
button. Your query appears in the Query field of the Query page in the DataSet dialog.
Note: On clicking the Save button, your query is automatically validated by the Visual Query Designer.
View the Report
- Place a data region like a Table onto the design surface and add fields to it. For more information on how to add fields to a table, see the Adding Data on the Table data region page.
- Click the preview tab to view the report with the Parameters panel displayed in the sidebar.
OR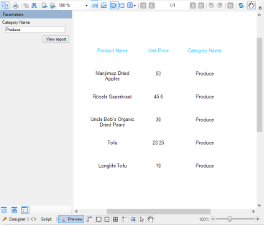
Open the report in the Viewer to view the report with the Parameters panel displayed in the sidebar. See Windows Forms Viewer for further information.