You can create a report using a stored procedure as a dataset. A stored procedure is a group of SQL statements that are used to encapsulate a set of operations or queries to execute on a database.
This walkthrough illustrates how to create a report that uses a stored procedure as a data set. The walkthrough is split into the following activities:
- Adding an ActiveReport to a Visual Studio project
- Connecting the report to a data source
- Adding a dataset (stored procedure) with a parameter
- Creating a layout for the report
- Viewing the report
- This walkthrough uses a table from the Reels database. By default, in ActiveReports, the Reels.mdb file is located in the [User Documents folder]\GrapeCity Samples\ActiveReports 11\Data folder.
- Although this walkthrough uses Page reports, you can also implement this using RDL reports.
When you complete this walkthrough you get a layout that looks similar to the following at design time and at run time.
Design-Time Layout
Run-Time Layout
To add an ActiveReport to the Visual Studio project
- Create a new Visual Studio project.
- From the Project menu, select Add New Item.
- In the Add New Item dialog that appears, select ActiveReports 11 Page Report and in the Name field, rename the file as StoredProcedure.
- Click the Add button to open a new fixed page report in the designer.
See Adding an ActiveReport to a Project for information on adding different report layouts.
To connect the report to a data source
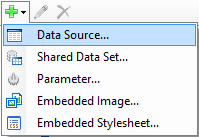
- In the Report Explorer, right-click the Data Sources node and select the Add Data Source option or select Data Source from the Add button.

- In the Report Data Source Dialog that appears, select the General page and in the Name field, enter a name like Reels.
- On this page, create a connection to the Reels database. See Connect to a Data Source for information on connecting to a data source.
To add a dataset with a parameter
- In the Report Explorer, right-click the data source node and select the Add Data Set option or select Data Set from the Add button.
- In the DataSet Dialog that appears, select the General page and enter the name of the dataset as SalesDataForStore. This name appears as a child node to the data source icon in the Report Explorer.
- On the Query page of this dialog, set the Command Type to Stored Procedure.
- On the Query page of this dialog, in the Query field enter the stored procedure name (e.g. SalesDataForStore).
Note: For Oracle data source, you should use the Text SQL query as command type instead of StoredProcedure to call a stored procedure.
- Click the Validate icon to validate the query. You may receive an error at this point since the required parameters have not yet been added.

- Go to the Parameters page and add a Parameter using the Add(+) button.
- On the same page, enter Name as StoreID and Value as 1002.
- Select the Query page of DataSet dialog, and click the Validate icon to validate the query and load the fields.
- Click OK to close the dialog. Your data set and queried fields appear as nodes in the Report Explorer.
To create a layout for the report
- From the toolbox, drag a Table data region onto the report design surface.
- In the Table data region, place your mouse over the cells of the table details row to display the field selection adorner.
- With the Table selected, right-click and open the Properties Window to set the following properties:
Property Name Property Value Location 0in, 0.5in Size 6.5in, 0.75in FixedSize 6.5in, 7in - Click the adorner to show a list of available fields from the SalesDataForStore dataset and add the following fields to the cells of the table details row.
This automatically places an expression in the detail row and simultaneously places a static label in the header row of the same column.Cell Field Left Cell StoreID Middle Cell UnitsSold Right Cell NetSales - Select the Header row by clicking the table handle to the left of the row and go to the Properties Window to set the following properties:
Property Name Property Value FontWeight Bold RepeatOnNewPage True - Click the column handle at the top of each column in turn to select it, and in the Properties Window, set the Width property as indicated in the table:
Column Width First 3.5in Second 2in Third 1in - Set the TextAlign property of all the columns to Left.
- From the toolbox, drag the Textbox onto the design surface to span the entire width of the report and go to the Properties Window to set the following properties:
Property Name Property Value TextAlign Center Size 6.5in, 0.35in Location 0in, 0.125in FontSize 14pt Value Net Sales by Store Tip: In a RDL report, you can also add a Page Header to place the Textbox control.
To view the report
- Click the preview tab to view the report at design time.
OR
- Open the report in the Viewer. See Windows Forms Viewer for further information.

