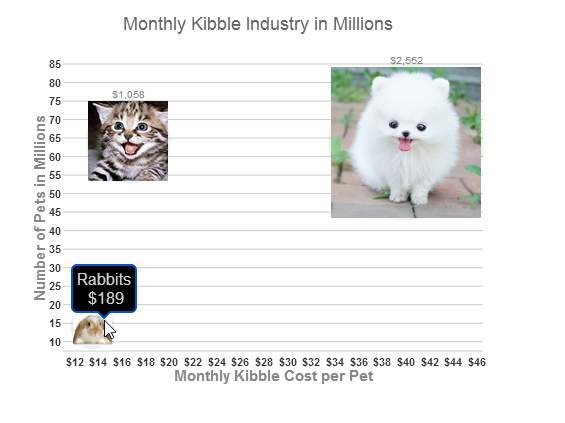
Building on the Quick Start example, you can add seriesList markers that use symbol objects, which contain links to image resources for each bubble in the series.
- In the <head> section of your HTML file, replace the script that includes the document ready function with this one, which does the following:
- Sets a title for the Y axis, and the following options on the X axis:
- The X axis has title text reading "Monthly Kibble Cost per Pet."
- X axis labels use C0 formatting (currency with no decimals) for the annotation format.
- Moves the chartLabel outside of each bubble and sets the chartLabelFormatString to use C0 (currency with no decimals).
- Adds a title to the chart using the header text attribute.
- Shows the Y1 values instead of Y values for the tooltip text (hint), and formats the values using C0.
- Hides the legend so that the X axis labels are not crowded.
- Sets the minimumSize to 10% and maximumSize to 50% of the chart area so that the images render larger.
- Creates three series in the seriesList with the following properties:
- Labels used in the tooltips display the pet type.
- The Y axis displays the number of pets (in millions) of each type.
- The X axis displays the monthly cost of kibble for each type of pet.
- The Y1 value sets the size of each pet type's bubble based on its monthly kibble industry.
- The markers for each series uses a symbol to specify the URL for an image of the pet type. (There is no need to set the index for the symbol, since we have only one data bubble in each series.)
Drop down and copy code
Set Images for Bubbles Script |
Copy Code |
<script id="scriptInit" type="text/javascript">
$(document).ready(function () {
$("#wijbubblechart").wijbubblechart({
axis: {
y: {text: "Number of Pets in Millions"},
x: {text: "Monthly Kibble Cost per Pet", annoFormatString: "C0"}
},
chartLabel: {position: "outside"},
chartLabelFormatString: "C0",
header: {text: "Monthly Kibble Industry in Millions"},
hint:{
content: function(){
return this.data.label + '\n ' + Globalize.format(this.y1, "C0") + '';
}
},
legend: {visible: false},
minimumSize: 10,
maximumSize: 50,
seriesList: [{
label: "Dogs",
data: {
x: [40],
y: [63.8],
y1: [2552]
},
markers: {
symbol: [
{url: "http://www.theberrytrip.com/blog/wp-content/uploads/2012/01/cute_dog.jpg"}
]}
}, {
label: "Cats",
data: {
x: [16.5],
y: [64.1],
y1: [1057.65]
},
markers: {
symbol: [
{url: "http://farm9.staticflickr.com/8109/8464699982_25d67631b6_t_d.jpg"}
]}
}, {
label: "Rabbits",
data: {
x: [13.5],
y: [14],
y1: [189]
},
markers: {
symbol: [
{url: "http://www.rabbitrunsandhutches.co.uk/wp-content/uploads/2012/08/rabbit-care-300x300-300x295.jpg"}
]}
}]
});
});
</script>
|
- No changes are necessary in the <body> section of your HTML file unless you want to increase the size to the pictured 500px by 400px.
- Save your HTML file and open it in a browser. The chart appears like the one in the image below, with images in place of bubbles.
See Also