Wijmo UI for the Web
Show Tick Marks

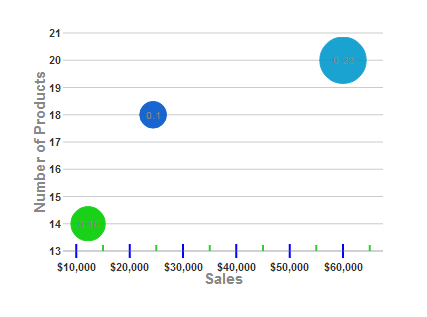
Building on the Quick Start example, you can add tickMajor and tickMinor objects, which contain styles for the axis tick marks.
Drop down and copy code
| Show Tick Marks Script |
Copy Code |
|---|---|
<script id="scriptInit" type="text/javascript">
$(document).ready(function () {
    $("#wijbubblechart").wijbubblechart({
        axis: {
            y: {text: "Number of Products"},
            x: {
                text: "Sales",
                annoFormatString: "C0",
                tickMajor: {position: "cross", style: {stroke: "blue"}},
                tickMinor: {position: "inside", style: {stroke: "limegreen"}}
                }
        },
        legend: {visible: false},
        seriesList: [
        {
            label: "Company A Market Share",
            data: { y: [14], x: [12200], y1: [.15] }
        }, {
            label: "Company B Market Share",
            data: { y: [20], x: [60000], y1: [.23] }
        }, {
            label: "Company C Market Share",
            data: { y: [18], x: [24400], y1: [.1] }
        }]
    });
});
</script>
| |
