Wijmo UI for the Web
Show Grid Lines
Wijmo User Guide > Widgets > Chart Widgets > BubbleChart > BubbleChart How To > Show Grid Lines

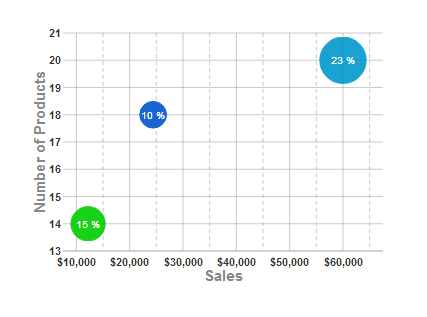
Building on the Quick Start example, you can add gridMajor and gridMinor objects, which contain styles for the axis grid lines.

  1. In the <head> section of your HTML file, replace the script that includes the document ready function with this one, which does the following:
    • Sets the following  options on the X axis:
      • The X axis has title text reading "Sales."
      • X axis labels use C0 formatting (currency with no decimals).
      • Grid Lines for each major value in the chart (gridMajor) have the stroke-dasharray attribute of the style set to "" so that the line is solid instead of dashed.
      • Grid lines for each minor value in the chart (gridMinor) are dashed, using the default. 
        Important: The visible attribute of the grid line determines whether to show it.
    • Hides the legend so that the X axis labels are not crowded.
    • Creates a series with the following properties:
      • Labels used in the tooltips read "Company X Market Share."
      • The Y axis displays the number of products for each company.
      • The X axis displays the sales for each company.
      • The Y1 value sets the size of each company's bubble based on its market share

    Drop down and copy code

    Show Grid Lines Script
    Copy Code
    <script id="scriptInit" type="text/javascript">
    $(document).ready(function () {
        $("#wijbubblechart").wijbubblechart({
            axis: {
                y: {text: "Number of Products"},
                x: {
                    text: "Sales", 
                    annoFormatString: "C0", 
                    gridMajor: {visible: true, style: {"stroke-dasharray": ""}},
                    gridMinor: {visible: true}
                    }
            },
            chartLabelFormatString: "p0",
            chartLabelStyle: {fill: "white"},
            legend: {visible: false},
            seriesList: [
            {
                label: "Company A Market Share",
                data: { y: [14], x: [12200], y1: [.15] }
            }, {
                label: "Company B Market Share",
                data: { y: [20], x: [60000], y1: [.23] }
            }, {
                label: "Company C Market Share",
                data: { y: [18], x: [24400], y1: [.1] }
            }]
        });
    });
    </script>
    
  2. No changes are necessary in the <body> section of your HTML file. The basic <div> tag is sufficient to create the chart.
  3. Save your HTML file and open it in a browser. The chart appears like the one in the image below, with solid major grid lines, and dashed minor grid lines.
See Also

Reference

Widgets