Wijmo UI for the Web
Add a Title
Wijmo User Guide > Widgets > Chart Widgets > BubbleChart > BubbleChart How To > Add a Title

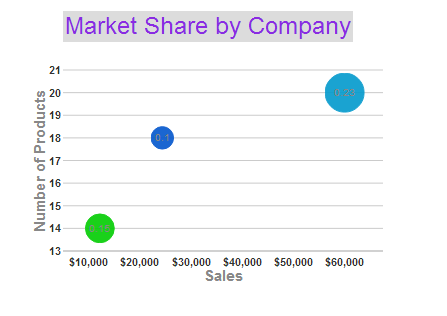
Building on the Quick Start example, you can add a header object to display a formatted title for your chart.

  1. In the <head> section of your HTML file, replace the script that includes the document ready function with this one, which does the following:
    • Sets the following options on the axes:
      • The Y axis has title text reading "Number of Products."
      • The X axis has title text reading "Sales."
      • X axis labels use C0 formatting (currency with no decimals).
    • Creates a header object with the following settings:
      • The background color is pale grey.
      • The title text reads "Market Share by Company."
      • The text renders in blue violet in a 24 point font.
    • Hides the legend so that the X axis labels are not crowded.
    • Creates a series with the following properties:
      • Labels used in the tooltips read "Company X Market Share."
      • The Y axis displays the number of products for each company.
      • The X axis displays the sales for each company.
      • The Y1 value sets the size of each company's bubble based on its market share.

    Add a header and create a chart

    Header Script
    Copy Code
    <script type="text/javascript">
    $(document).ready(function () {
        $("#wijbubblechart").wijbubblechart({
            axis: {
                //sets the title text for the Y axis
                y: {text: "Number of Products"},
                //sets  the title text for the X axis and formats 
                //the X axis labels as currency with no decimal spaces
                x: {text: "Sales", annoFormatString: "C0"}
            },
            header: {
                //sets the background color of the header to pale grey
                style: {fill: "gainsboro"},
                //sets the text to display in the header
                text: "Market Share by Company",
                //sets the header text style
                textStyle: {"font-size": 24, fill: "blueviolet"}
            },
            //hides the legend
            legend: {visible: false},
            //adds three data series to the chart
            seriesList: [
            {
                //sets the text to use in the tooltip for the bubble
                label: "Company A Market Share",
                //sets the Y value (number of products),
                //the X value (sales), and the Y1 (market share)
                data: { y: [14], x: [12200], y1: [.15] }
            }, {
                label: "Company B Market Share",
                data: { y: [20], x: [60000], y1: [.23] }
            }, {
                label: "Company C Market Share",
                data: { y: [18], x: [24400], y1: [.1] }
            }]
        });
    });
    </script>
    
  2. No changes are necessary in the <body> section of your HTML file. The basic <div> tag is sufficient to create the chart.
  3. Save your HTML file and open it in a browser. The chart appears like the one in the image below, with a header object displaying the chart title.
See Also

Reference

Widgets