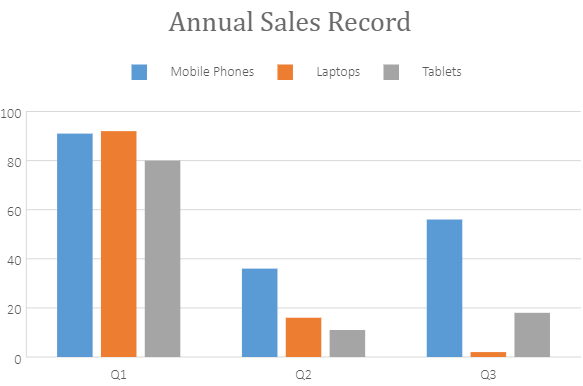
Legends refer to the labels in a chart that help users in understanding the plotted data. A legend entry in a chart refers to the name of the data category that is plotted in the chart. Each legend entry in a chart possesses a unique color for better data visualization.
A basic image with three legend entries : Mobile Phones, Laptops and Tablets is shown below:

When a chart is created in Spread.Sheets, legends appear on the bottom of the spreadsheet (by default). However, you can get or set the legends of the chart, change the position of the legend(top, bottom, left or right), and control whether to show the legend in the chart using the legend method and LegendPosition enumeration.
Using Code
This code shows how to configure legends in the chart.
| JavaScript |
Copy Code
|
|---|---|
|
//Configure Legend |
|