The chart functionality in Spread.Sheets is provided as a plugin feature which makes it extremely easy for users to create charts and gives them the flexibility to customize it.
With extensive support for eight chart groups, twenty-eight chart types and combo chart ability, you can insert any kind of two-dimensional charts in your spreadsheets, set custom chart layout, customize chart elements as per your preferences and combine multiple chart types in order to evaluate financial information, perform stock analysis, and look over sales revenues in just a few clicks.
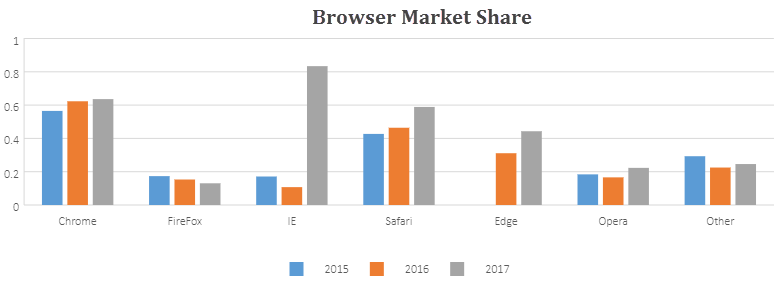
The most basic example of a chart is shown below:
For more information on configuring chart elements for custom chart layout, see Configuring Chart Elements.
For working with chart types, see Working with Chart Types.