Gridlines refers to the horizontal and vertical lines appearing in the plot area of a chart.
In Spread.sheets, the major GridLine and minor Gridline have same type. You can get or set the style of the gridLine, set their color, width and the visibility.
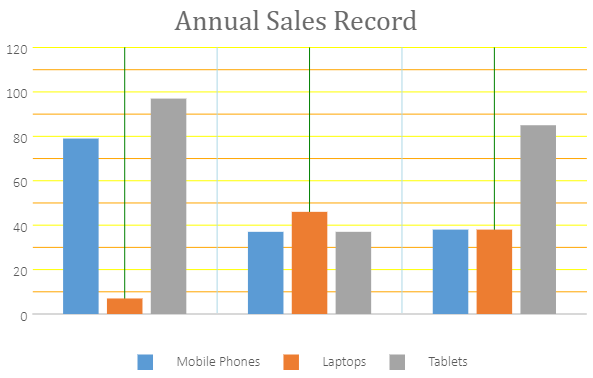
A basic image with configuration of major and minor gridlines for primary category axis and the primary value axis is shown below.
Using Code
This code shows how to configure major gridlines and minor gridlines in the chart for primary category axis and primary value axis.
| JavaScript |
Copy Code
|
|---|---|
|
//Configure chart gridlines axes.primaryValue.minorGridLine.visible = true; axes.primaryCategory.majorGridLine.visible = true; axes.primaryCategory.minorGridLine.visible = true; |
|